Frasers Group Plc (LSE:FRAS), smells unlike roses…

#FTSE #Stoxx50  

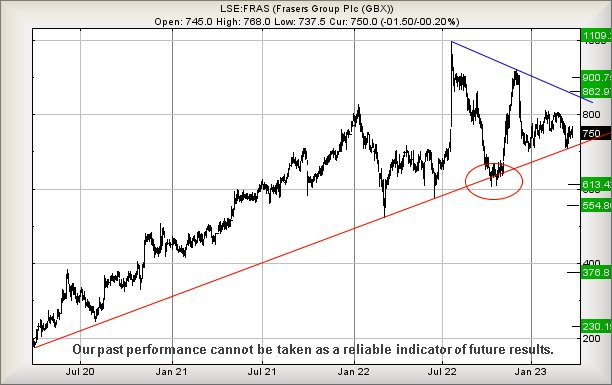
We can be a little paranoid about warning signs against share price movements. For instance, the image below for clothing retailer, Frasers Group Plc, displays a bit of a stunner, something which actually makes some sense when you think about it. BP actually had something pretty similar, prior to Deepwater Horizon, and aAlso, Wall St experienced a dip below the uptrend, prior to events in Sept 2001. It’s got nothing to do with the markets being prescient.

This sort of thing happens all the time, a solid uptrend breaking and we suspect all it implies is the potential for weakness in a price movement, essentially the market broadcasting “this trend in no sacred, it can break!” However, should a share price move below the level of a historical ‘warning’ break of a trend, it’s definitely the time to jog along to your local Sports Direct and buy running shoes as a worst case scenario may be about to come true.


As an aside, the Frasers Group of today really have nothing in common with the historical House of Fraser in Glasgow, a company formed around 170 years ago and the subject of utter dread every December in the 1970’s. For some reason, always designated as my mothers official bag carrier, spending hours in the awful place buying Xmas gifts for everyone (except me) left only a memory of the utter stink of perfume. The perfume department was on the ground floor, a vastly overheated area with the samples smell permeating upward to contaminate the entire massive store and we’d finally leave, me with a headache, safe in the knowledge I’d once again be getting Book and Music shop vouchers. This wasn’t a shop which generated fond memories for this particular child.

In the case of Frasers Group share price currently, the Red uptrend has been confirmed multiple times since 2020.

Should early signals for trouble be needed, share price closure below 720 looks capable of breaking Red and promoting weakness to a non threatening 613p with secondary, if broken, a rather nasty looking 554p. As we alluded earlier, anything capable of bringing a share price below the circled Red trend break value is liable to be quite dangerous, taking the share price into a zone where a sharp reversal cycle to 376, perhaps even a bottom of 230p becomes probable.


In the event Frasers Group intends an emergency escape from this troubling picture, share price movements above just 807p calculate with the chances of a lift to 862p next with secondary, if beaten, at 900p and an expectation of some hesitation. From our perspective, the share price needs closure above 900p to suggest considerable strength has entered the fray and a future exists which may not stink!


FUTURES

Time Issued Market Price At Issue Short Entry Fast Exit Slow Exit Stop Long Entry Fast Exit Slow Exit Stop Prior
9:41:35PM BRENT 78.45 ‘cess
9:44:25PM GOLD 1974.02
9:46:57PM FTSE 7470.72 7449 7435 7405 7488 7503 7515 7537 7477
9:48:40PM STOX50 4173.3 4153 4131 4104 4178 4212 4228 4275 4171
10:05:52PM GERMANY 15142.15
10:08:03PM US500 3977.09 ‘cess
10:10:03PM DOW 32425.6
10:12:01PM NASDAQ 12629 Success
10:17:04PM JAPAN 27496 ‘cess


28/03/2023 FTSE Closed at 7484 points. Change of 0.17%. Total value traded through LSE was: £ 6,680,856,903 a change of 37.06%
27/03/2023 FTSE Closed at 7471 points. Change of 0.89%. Total value traded through LSE was: £ 4,874,298,034 a change of -13.9%
24/03/2023 FTSE Closed at 7405 points. Change of -1.25%. Total value traded through LSE was: £ 5,661,322,709 a change of -17%
23/03/2023 FTSE Closed at 7499 points. Change of -0.89%. Total value traded through LSE was: £ 6,821,003,257 a change of 31.84%
22/03/2023 FTSE Closed at 7566 points. Change of 0.4%. Total value traded through LSE was: £ 5,173,752,790 a change of 1.87%
21/03/2023 FTSE Closed at 7536 points. Change of 1.8%. Total value traded through LSE was: £ 5,078,878,926 a change of -18.94%
20/03/2023 FTSE Closed at 7403 points. Change of 0.93%. Total value traded through LSE was: £ 6,265,515,535 a change of -57.61%

SUCCESS above means both FAST & SLOW targets were met. ‘CESS means just the FAST target met and probably the next time it is exceeded, movement to the SLOW target shall commence.

Our commentary is in two sections. Immediately below are today’s updated comments. If our commentary remains valid, the share can be found in the bottom section which has a RED heading. Hopefully, this will mean you no longer need to flip back through previous reports. HYPERLINKS DISABLED IN THIS VERSION

Please remember, all prices are mid-price (halfway between the Buy and Sell). When we refer to a price CLOSING above a specific level, we are viewing the point where we can regard a trend as changing. Otherwise, we are simply speculating on near term trading targets. Our website is www.trendsandtargets.com.

UPDATE. We often give an initial and a secondary price. If the initial is exceeded, we still expect it to fall back but the next time the initial is bettered, the price should continue to the secondary. The converse it true with price drops.

We can be contacted at info@trendsandtargets.com. Spam filters set to maximum so only legit emails get through…

Section One – Outlook Updated Today. Click here for Section Two – Outlook Remains Valid shares

Click Epic to jump to share: LSE:BP. BP PLC** **LSE:CASP Caspian** **LSE:CCL Carnival** **LSE:GKP Gulf Keystone** **LSE:ITM ITM Power** **LSE:RBD Reabold Resources PLC** **LSE:SMT Scottish Mortgage Investment Trust** **

********

Updated charts published on : BP PLC, Caspian, Carnival, Gulf Keystone, ITM Power, Reabold Resources PLC, Scottish Mortgage Investment Trust,

LSE:BP. BP PLC. Close Mid-Price: 507.8 Percentage Change: + 2.30% Day High: 510.5 Day Low: 503.1

Further movement against BP PLC ABOVE 510.5 should improve acceleration t ……..

Subscribe for more

</p

View Previous BP PLC & Big Picture ***

LSE:CASP Caspian Close Mid-Price: 6.2 Percentage Change: -3.88% Day High: 6.45 Day Low: 6.1

Weakness on Caspian below 6.1 will invariably lead to 5.25 with secondary ……..

Subscribe for more

</p

View Previous Caspian & Big Picture ***

LSE:CCL Carnival. Close Mid-Price: 664.6 Percentage Change: + 1.84% Day High: 676.8 Day Low: 629

Continued weakness against CCL taking the price below 629 calculates as l ……..

Subscribe for more

</p

View Previous Carnival & Big Picture ***

LSE:GKP Gulf Keystone. Close Mid-Price: 158 Percentage Change: + 9.42% Day High: 161.8 Day Low: 144.8

This is getting a bit interesting as above 162 looks like it has the poten ……..

Subscribe for more

</p

View Previous Gulf Keystone & Big Picture ***

LSE:ITM ITM Power Close Mid-Price: 69.42 Percentage Change: -4.67% Day High: 73.5 Day Low: 69.26

If ITM Power experiences continued weakness below 69.26, it will invariab ……..

Subscribe for more

</p

View Previous ITM Power & Big Picture ***

LSE:RBD Reabold Resources PLC Close Mid-Price: 0.18 Percentage Change: -1.33% Day High: 0.19 Day Low: 0.18

Continued weakness against RBD taking the price below 0.18 calculates as ……..

Subscribe for more

</p

View Previous Reabold Resources PLC & Big Picture ***

LSE:SMT Scottish Mortgage Investment Trust Close Mid-Price: 643 Percentage Change: -1.14% Day High: 652.8 Day Low: 641.6

Target met. In the event Scottish Mortgage Investment Trust experiences w ……..

Subscribe for more

</p

View Previous Scottish Mortgage Investment Trust & Big Picture ***

*** End of “Updated Today” comments on shares.

Scotgold Resources (LSE:SGZ), gonna need a bigger hole…

#Gold #SP500

Regular readers will know of our utter distaste for negative share splits, price movements designed to make a share sound more respectable. Often, for the longer term, whatever culture permeated a company, causing any initial share split, remains, creating the same situation again. Scotgold in Tyndrum, guilty of 100:1 surgery in 2017, saw their share price boost from around 0.4p up to a pretend 40p in a blink.

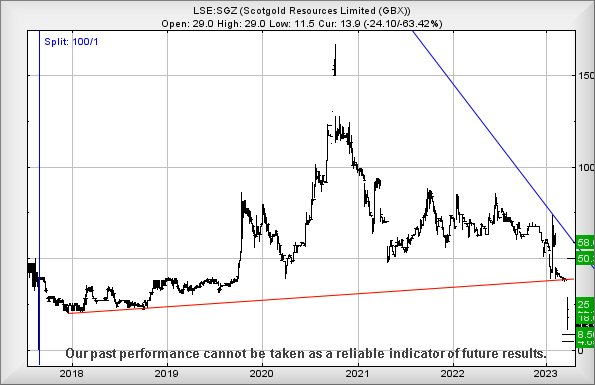
The manoeuvre, we’ll take 100 of your shares and give you a brand new single shiny one back, rarely seems to work out for the longer term, victims from prior to the share split being the ones who obviously pay. For instance, folk from 2012 “only” need see Scotgold move above 6 quid until they find themselves in profit. Glancing at the chart below, it’s easy to suspect Scotgold may soon consider yet another share split as the immediate future looks pretty vile.

Movement next below 11.5p looks very capable of a trip down to 8.5p next, perhaps with a bounce. Our secondary, if such a level breaks, works out at just 4p, a price level below which we cannot calculate as every target gets prefaced with a minus sign.

In the event any miracles are planned (it is nearly Easter) apparently the share price only needs exceed 15.5 to make an attempt at 18 next with our secondary, if bettered, at 22p (which may be 25p, thanks to the market gapping the price down. Unfortunately, this feels like it has similar quality to a dead cat bounce, none of the targets coming close to 32p, above which the market would be forced to concede it was all a dreadful mistake.

We fear, despite Gold prices being at record high levels, Scotlands Gold miner intends drill down to the 4p level and hopefully shall discover an excuse for the market to gap the share price up substantially. Currently we’re lacking optimism, suspecting the market doesn’t inflict a minus 63% day without good reason. Perhaps the Earnings Report due later this week shall contain good news…


FUTURES

Time Issued Market Price At Issue Short Entry Fast Exit Slow Exit Stop Long Entry Fast Exit Slow Exit Stop Prior
9:50:36PM BRENT 77.79 Success
9:53:19PM GOLD 1956.21 1943 1929 1925 1959 1978 1987 2002 1963 Success
9:55:14PM FTSE 7510.52 ‘cess
9:57:25PM STOX50 4185
9:59:45PM GERMANY 15187
10:01:59PM US500 3988 3969 3955 3938 3990 4006 4013 4026 3986 ‘cess
10:25:46PM DOW 32484 Success
10:27:44PM NASDAQ 12696
10:29:52PM JAPAN 27591 ‘cess


27/03/2023 FTSE Closed at 7471 points. Change of 0.89%. Total value traded through LSE was: £ 4,874,298,034 a change of -13.9%
24/03/2023 FTSE Closed at 7405 points. Change of -1.25%. Total value traded through LSE was: £ 5,661,322,709 a change of -17%
23/03/2023 FTSE Closed at 7499 points. Change of -0.89%. Total value traded through LSE was: £ 6,821,003,257 a change of 31.84%
22/03/2023 FTSE Closed at 7566 points. Change of 0.4%. Total value traded through LSE was: £ 5,173,752,790 a change of 1.87%
21/03/2023 FTSE Closed at 7536 points. Change of 1.8%. Total value traded through LSE was: £ 5,078,878,926 a change of -18.94%
20/03/2023 FTSE Closed at 7403 points. Change of 0.93%. Total value traded through LSE was: £ 6,265,515,535 a change of -57.61%
17/03/2023 FTSE Closed at 7335 points. Change of -1.01%. Total value traded through LSE was: £ 14,781,854,376 a change of 86.96%

SUCCESS above means both FAST & SLOW targets were met. ‘CESS means just the FAST target met and probably the next time it is exceeded, movement to the SLOW target shall commence.

Our commentary is in two sections. Immediately below are today’s updated comments. If our commentary remains valid, the share can be found in the bottom section which has a RED heading. Hopefully, this will mean you no longer need to flip back through previous reports. HYPERLINKS DISABLED IN THIS VERSION

Please remember, all prices are mid-price (halfway between the Buy and Sell). When we refer to a price CLOSING above a specific level, we are viewing the point where we can regard a trend as changing. Otherwise, we are simply speculating on near term trading targets. Our website is www.trendsandtargets.com.

UPDATE. We often give an initial and a secondary price. If the initial is exceeded, we still expect it to fall back but the next time the initial is bettered, the price should continue to the secondary. The converse it true with price drops.

We can be contacted at info@trendsandtargets.com. Spam filters set to maximum so only legit emails get through…

Section One – Outlook Updated Today. Click here for Section Two – Outlook Remains Valid shares

Click Epic to jump to share: LSE:BBY BALFOUR BEATTY** **LSE:CCL Carnival** **LSE:EME Empyrean** **LSE:GENL Genel** **LSE:GKP Gulf Keystone** **LSE:ITM ITM Power** **LSE:QFI Quadrise** **

********

Updated charts published on : BALFOUR BEATTY, Carnival, Empyrean, Genel, Gulf Keystone, ITM Power, Quadrise,

LSE:BBY BALFOUR BEATTY. Close Mid-Price: 376 Percentage Change: + 1.29% Day High: 379.2 Day Low: 373.6

Continued trades against BBY with a mid-price ABOVE 379.2 should improve ……..

Subscribe for more

</p

View Previous BALFOUR BEATTY & Big Picture ***

LSE:CCL Carnival. Close Mid-Price: 652.6 Percentage Change: + 0.00% Day High: 700 Day Low: 647.4

Weakness on Carnival below 647.4 will invariably lead to 600 and hopefull ……..

Subscribe for more

</p

View Previous Carnival & Big Picture ***

LSE:EME Empyrean Close Mid-Price: 1.05 Percentage Change: -4.56% Day High: 0 Day Low: 0

In the event Empyrean experiences weakness below 1.05 it calculates with ……..

Subscribe for more

</p

View Previous Empyrean & Big Picture ***

LSE:GENL Genel Close Mid-Price: 110 Percentage Change: -6.30% Day High: 114 Day Low: 98.6

Target met. If Genel experiences continued weakness below 98.6, it will i ……..

Subscribe for more

</p

View Previous Genel & Big Picture ***

LSE:GKP Gulf Keystone Close Mid-Price: 144.4 Percentage Change: -16.72% Day High: 169.2 Day Low: 130.2

Target met. Weakness on Gulf Keystone below 130.2 will invariably lead to ……..

Subscribe for more

</p

View Previous Gulf Keystone & Big Picture ***

LSE:ITM ITM Power Close Mid-Price: 72.82 Percentage Change: -2.98% Day High: 78.52 Day Low: 72.86

Continued weakness against ITM taking the price below 72.86 calculates as ……..

Subscribe for more

</p

View Previous ITM Power & Big Picture ***

LSE:QFI Quadrise Close Mid-Price: 1.52 Percentage Change: -7.89% Day High: 1.6 Day Low: 1.5

This is starting to have the potential of being mildly interesting, needin ……..

Subscribe for more

</p

View Previous Quadrise & Big Picture ***

*** End of “Updated Today” comments on shares.

Lloyds Banking (LSE:LLOY) & Deutsche Bank (XE:DBK). And croissants!

#Brent #Dax

Sometimes, I suspect my foibles drive my wife crazy.  She’ll sometimes go to bed around 9pm, thanks to a commute which starts at 5am and as every bloke knows, you’re only wide awake from 9pm onward. In the last year, evenings same me built a rock grinding machine, a generator, and a room heater for pyromaniacs. But top marks were awarded to my bread making fascination.

As a Coeliac, gluten free bread became essential and as a Diabetic, the right bread was difficult to say the least. Eventually producing something which was edible though quite literally unable to be toasted, possibly due to almond flour creating fireproof content. But I kept experimenting while my wife slept, constantly improving/changing the recipe until things started to approach the dizzy heights of edible. Unfortunately, along came Deutsche Bank and the inevitable memory of Munich hauptbahnhof (central station), a delight in the 1990’s when travelling to Frankfurt for waste of time meetings. Early mornings at the hauptbahnhof introduced me to chocolate croissants, possibly the best in the world, from one of the many vendors with carts. They were literally so good, when I left Munich for the last time to drive home, a stop at the railway station to pick up an order of 40 was mandated.

Inspiration comes from strange places! Deutsche Bank’s troubles a reminder of Munich station, influenced an attempt to reproduce the flavour of these croissants and thankfully, success arrived just before the clocks changed for summer. Rather than employ normal chocolate, nirvana came from dark chocolate with something like 90% cacoa, safe for Diabetics and, to be fair, pretty disgusting otherwise. But grating the stuff and embedding a layer into my bread mix, once the dough had sat for an hour or two, created a dough which, when cooked, took me back to Munich and the perfect croissant.


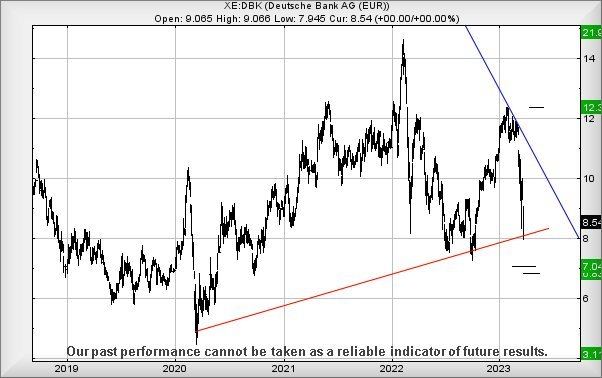
No matter how kindly I’m inclined toward Germany (just because of a croissant!), it looks certain Deutsche Bank are in quite a bit of trouble. Weakness continuing below 7.94 looks very capable of an attempt at 7.04 next with secondary, if broken, at 6.83. The proximity of these target levels tends suggest an imminent bounce point, one which is visually hard to justify as overall, there’s a heck of an argument suggesting our croissant inspiration shall eventually bottom at 3.11€

At present, DBK needs above 10.4€ to escape this horrible and ridiculous looking fate, a share price lower than the good old days of Covid-19 and 4.44€. Who knows, perhaps the market shall believe the platitudes from German politicians stating Deutsche Bank is as solid as they come?


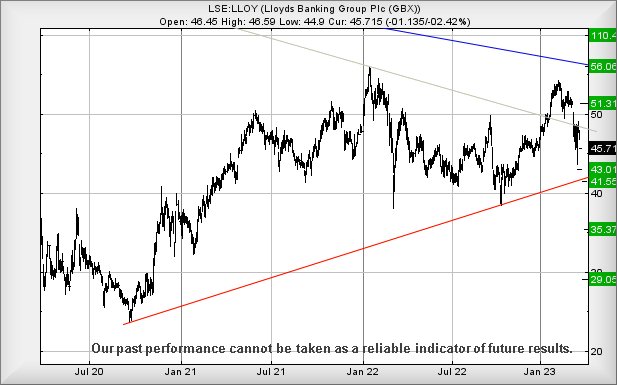
Lloyds Bank managed to assiduously avoid being gapped above 54p in the period since our last analysis,  calling into question any reason for optimism. While manipulation gaps have certainly appeared against Lloyds, the imperative has been to force the price downward, the share price clearly singing from the same songbook as the rest of the banking sector. The situation now is quite caustic, demanding Lloyds trade above 49.5p to next enter a cycle to 51.3p with secondary, if exceeded, calculation at a potentially game changing 56p.

However, the converse is now looking dangerously probable.

Lloyds Banking Group has now closed at the lowest level of 2023, the share price looking dodgy and doubtless reflecting the confidence folk feel, once again, for the prospects for the banking sector. From a glance through internet chat rooms, about the only saving grace was a comment from a team of analysts at Bank of America, suggesting they’ve identified the next market bubble and now is the time to sell shares rather than buy. A fairly straightforward suggestion is, if a bank says one thing, it’s probably the perfect time to do the exact opposite!


On the basis the plethora of signals advocating more reversals in bank share prices shall prove correct, Lloyds has the capacity to become troubling, should their share price stumble below 44.9p as reversal to an initial 43p calculates as possible. Breakage of such a target level is troublesome, working out with the chance of a visit to 41.5p, along with a distinct probability of the price closing a session below Red on the chart. This would effectively move the share value from Near Term calculations into Bigger Picture calculations with the opportunity for more energetic reversals, perhaps even kicking off a cycle which shall hopefully bottom eventually around the 29p level.

We live in interesting times.

FUTURES

Time Issued Market Price At Issue Short Entry Fast Exit Slow Exit Stop Long Entry Fast Exit Slow Exit Stop
9:55:47PM BRENT 74.69 72.33 71.95 70.23 73.87 75.1 76.08 77.33 74
9:57:21PM GOLD 1978.98 1989
9:59:24PM FTSE 7424.75 7408
10:02:26PM STOX50 4151.8 4175
10:04:25PM GERMANY 15019 14901 14853 14700 14984 15183 15271 15428 15086
10:07:59PM US500 3971.02 3942
10:10:55PM DOW 32252 32028
10:13:16PM NASDAQ 12765 12699
10:16:27PM JAPAN 27386 27292


24/03/2023 FTSE Closed at 7405 points. Change of -1.25%. Total value traded through LSE was: £ 5,661,322,709 a change of -17%
23/03/2023 FTSE Closed at 7499 points. Change of -0.89%. Total value traded through LSE was: £ 6,821,003,257 a change of 31.84%
22/03/2023 FTSE Closed at 7566 points. Change of 0.4%. Total value traded through LSE was: £ 5,173,752,790 a change of 1.87%
21/03/2023 FTSE Closed at 7536 points. Change of 1.8%. Total value traded through LSE was: £ 5,078,878,926 a change of -18.94%
20/03/2023 FTSE Closed at 7403 points. Change of 0.93%. Total value traded through LSE was: £ 6,265,515,535 a change of -57.61%
17/03/2023 FTSE Closed at 7335 points. Change of -1.01%. Total value traded through LSE was: £ 14,781,854,376 a change of 86.96%
16/03/2023 FTSE Closed at 7410 points. Change of 0.9%. Total value traded through LSE was: £ 7,906,260,016 a change of -5.19%

SUCCESS above means both FAST & SLOW targets were met. ‘CESS means just the FAST target met and probably the next time it is exceeded, movement to the SLOW target shall commence.

Our commentary is in two sections. Immediately below are today’s updated comments. If our commentary remains valid, the share can be found in the bottom section which has a RED heading. Hopefully, this will mean you no longer need to flip back through previous reports. HYPERLINKS DISABLED IN THIS VERSION

Please remember, all prices are mid-price (halfway between the Buy and Sell). When we refer to a price CLOSING above a specific level, we are viewing the point where we can regard a trend as changing. Otherwise, we are simply speculating on near term trading targets. Our website is www.trendsandtargets.com.

UPDATE. We often give an initial and a secondary price. If the initial is exceeded, we still expect it to fall back but the next time the initial is bettered, the price should continue to the secondary. The converse it true with price drops.

We can be contacted at info@trendsandtargets.com. Spam filters set to maximum so only legit emails get through…

Section One – Outlook Updated Today. Click here for Section Two – Outlook Remains Valid shares

Click Epic to jump to share: LSE:AML Aston Martin** **LSE:AVCT Avacta** **LSE:CCL Carnival** **LSE:EME Empyrean** **LSE:ITM ITM Power** **LSE:ITRK Intertek** **LSE:SDY Speedyhire** **

********

Updated charts published on : Avacta, Carnival, Empyrean, ITM Power, Intertek, Speedyhire,

LSE:AML Aston Martin Close Mid-Price: 212.8 Percentage Change: -4.10% Day High: 226.9 Day Low: 210.5

Target met. Weakness on Aston Martin below 210.5 will invariably lead to ……..

Subscribe for more

</p

View Previous Aston Martin & Big Picture ***

LSE:AVCT Avacta. Close Mid-Price: 113.5 Percentage Change: + 0.89% Day High: 116.5 Day Low: 108.5

In the event Avacta experiences weakness below 108.5 it calculates with a ……..

Subscribe for more

</p

View Previous Avacta & Big Picture ***

LSE:CCL Carnival Close Mid-Price: 652.6 Percentage Change: -2.54% Day High: 681.8 Day Low: 648.2

If Carnival experiences continued weakness below 648.2, it will invariabl ……..

Subscribe for more

</p

View Previous Carnival & Big Picture ***

LSE:EME Empyrean Close Mid-Price: 1.1 Percentage Change: -11.49% Day High: 1.1 Day Low: 1.1

Continued weakness against EME taking the price below 1.1 calculates as l ……..

Subscribe for more

</p

View Previous Empyrean & Big Picture ***

LSE:ITM ITM Power Close Mid-Price: 75.06 Percentage Change: -4.02% Day High: 78.98 Day Low: 72.92

In the event ITM Power experiences weakness below 72.92 it calculates wit ……..

Subscribe for more

</p

View Previous ITM Power & Big Picture ***

LSE:ITRK Intertek Close Mid-Price: 3923 Percentage Change: -1.97% Day High: 3997 Day Low: 3906

If Intertek experiences continued weakness below 3906, it will invariably ……..

Subscribe for more

</p

View Previous Intertek & Big Picture ***

LSE:SDY Speedyhire Close Mid-Price: 33.25 Percentage Change: -0.75% Day High: 33.5 Day Low: 32.9

Weakness on Speedyhire below 32.9 will invariably lead to 31.7 with secon ……..

Subscribe for more

</p

View Previous Speedyhire & Big Picture ***

*** End of “Updated Today” comments on shares.

FTSE for Friday (FTSE:UKX), one year out…

#FTSE #GOLD

I always had a soft spot for Radio 2’s Ken Bruce, if only because we attended the same primary school, tho’ quite a few years apart. His popular Popmaster quiz show had a question section, asking callers to name the year when something charted. Inevitably, callers were wrong, prompting the show host to utter “One Year Out!”, something which became a catchphrase.

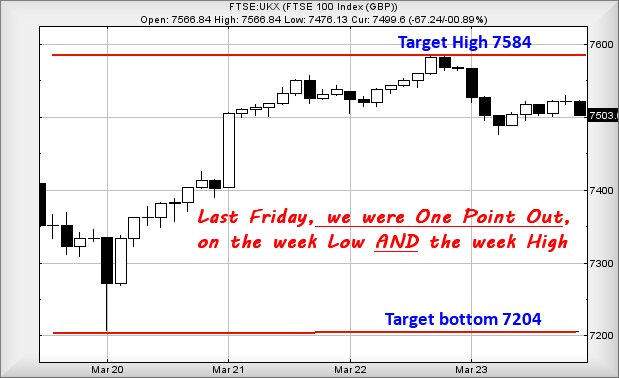
Last weeks FTSE for Friday enacted something similar for ourselves, the potential Short position bouncing from 7205 points on Monday, whereas our secondary target was 7204 points. One Point Out and perhaps the bounce slightly above the 206 point drop implied the potential for strength, even though it was just one point.

And then came Wednesday…

Wednesday decided to trigger our converse Long scenario for the FTSE, the session successfully topping out at 7585 points. Our secondary target had been 7584 points. Again, One Point Out and a successful gain of 174 points.  Perhaps, by beating our gain target by a single point, it also implies the potential for strength.

The mad thing is, last Friday we successfully managed to define both the Low and the High for the coming week, something which wasn’t really our intention. But in producing targets for the near future, the ugly issue of time always appears. We always feel timeframes are a pretty major issue, whereas numbers rarely lie and simply open the door for patience. The aim in our Friday column is to look at both the Big Picture and immediate picture, trying to discover areas where both scenario create similar target levels. With this method, about the best we dare hope is a “within living memory” approach, one which thankfully works out fairly reliably.

But this is certainly the first time we can remember defining the highs and lows of a week on the market. Of course, we’re a little nervous decreeing strength is now upon as “One Point Out” doesn’t present the most confident argument of strength for the future, thanks to a single point only representing 0.13% of movement from a 7410 starting point!

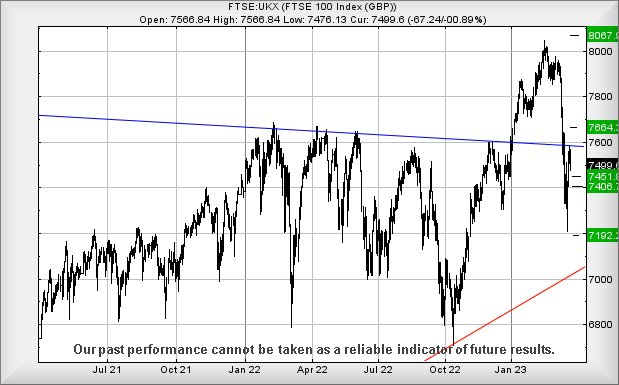
Importantly, the FTSE still has not managed to regain a place above the Blue downtrend since 2018, a pity as this would be almost a “no brainer” signal to imply a cycle upward is expected. The immediate picture presents a scenario, where movement next above 7592 looks capable of dragging the index upward to an initial 7664 points with secondary, if bettered, an impressive 8067 points. If triggered, the market will require to slither below 7500 to make it suddenly unlikely. Maybe it all depends on whether the market intends to trap the FTSE within the Red tramlines on the chart above.


Our converse scenario for a short position actually looks more likely.

Trouble now below 7475 points should prove capable of triggering reversal to an initial 7451 points with secondary, if broken, down at 7406 points. Neither reversal potential “sticks the boot in” but there’s a serious issue if our secondary breaks as a visit to 7192 calculates as possible!


Have a good weekend. No Formula 1, so expect a boring one.

FUTURES

Time Issued Market Price At Issue Short Entry Fast Exit Slow Exit Stop Long Entry Fast Exit Slow Exit Stop Prior
9:51:42PM BRENT 75.26 74.76 74.565 75.9 77.16 77.725 75.82
9:54:37PM GOLD 1994.1 1963 1949 1984 2004 2011 1988 ‘cess
9:56:49PM FTSE 7455.9 7412 7367 7465 7463 7475 7428 ‘cess
9:59:12PM STOX50 4181.3 4154 4148 4182 4218 4246 4173 Shambles
10:03:50PM GERMANY 15144 15007 14950 15159 15159 15223 15113 ‘cess
10:06:43PM US500 3955.84 3936 3911 3955 3986 4008 3957
10:43:11PM DOW 32118 31832 31618 32170 32247 32400 32061
10:45:15PM NASDAQ 12710 12584 12442 12750 12814 12865 12710
10:47:01PM JAPAN 27316 27168 27105 27370 27389 27476 27305


23/03/2023 FTSE Closed at 7499 points. Change of -0.89%. Total value traded through LSE was: £ 6,821,003,257 a change of 31.84%
22/03/2023 FTSE Closed at 7566 points. Change of 0.4%. Total value traded through LSE was: £ 5,173,752,790 a change of 1.87%
21/03/2023 FTSE Closed at 7536 points. Change of 1.8%. Total value traded through LSE was: £ 5,078,878,926 a change of -18.94%
20/03/2023 FTSE Closed at 7403 points. Change of 0.93%. Total value traded through LSE was: £ 6,265,515,535 a change of -57.61%
17/03/2023 FTSE Closed at 7335 points. Change of -1.01%. Total value traded through LSE was: £ 14,781,854,376 a change of 86.96%
16/03/2023 FTSE Closed at 7410 points. Change of 0.9%. Total value traded through LSE was: £ 7,906,260,016 a change of -5.19%
15/03/2023 FTSE Closed at 7344 points. Change of -3.84%. Total value traded through LSE was: £ 8,338,790,623 a change of 43.77%

SUCCESS above means both FAST & SLOW targets were met. ‘CESS means just the FAST target met and probably the next time it is exceeded, movement to the SLOW target shall commence.

Our commentary is in two sections. Immediately below are today’s updated comments. If our commentary remains valid, the share can be found in the bottom section which has a RED heading. Hopefully, this will mean you no longer need to flip back through previous reports. HYPERLINKS DISABLED IN THIS VERSION

Please remember, all prices are mid-price (halfway between the Buy and Sell). When we refer to a price CLOSING above a specific level, we are viewing the point where we can regard a trend as changing. Otherwise, we are simply speculating on near term trading targets. Our website is www.trendsandtargets.com.

UPDATE. We often give an initial and a secondary price. If the initial is exceeded, we still expect it to fall back but the next time the initial is bettered, the price should continue to the secondary. The converse it true with price drops.

We can be contacted at info@trendsandtargets.com. Spam filters set to maximum so only legit emails get through…

Section One – Outlook Updated Today. Click here for Section Two – Outlook Remains Valid shares

Click Epic to jump to share: LSE:AML Aston Martin** **LSE:AVCT Avacta** **LSE:CCL Carnival** **LSE:SMT Scottish Mortgage Investment Trust** **

********

Updated charts published on : Aston Martin, Avacta, Carnival, Scottish Mortgage Investment Trust,

LSE:AML Aston Martin Close Mid-Price: 221.9 Percentage Change: -0.89% Day High: 228 Day Low: 217.3

Below 216 still indicates 213 with some bounce potentials but, if broken, ……..

Subscribe for more

</p

View Previous Aston Martin & Big Picture ***

LSE:AVCT Avacta Close Mid-Price: 112.5 Percentage Change: -5.06% Day High: 117.5 Day Low: 111

Continued weakness against AVCT taking the price below 111 calculates as ……..

Subscribe for more

</p

View Previous Avacta & Big Picture ***

LSE:CCL Carnival. Close Mid-Price: 669.6 Percentage Change: + 0.27% Day High: 686 Day Low: 650.8

Movement now below 650 suggests coming weakness to 600 and hopefully a bou ……..

Subscribe for more

</p

View Previous Carnival & Big Picture ***

LSE:SMT Scottish Mortgage Investment Trust. Close Mid-Price: 670 Percentage Change: + 2.17% Day High: 670.8 Day Low: 643.8

If Scottish Mortgage Investment Trust experiences continued weakness belo ……..

Subscribe for more

</p

View Previous Scottish Mortgage Investment Trust & Big Picture ***
*** End of “Updated Today” comments on shares.

Tesco Plc (LSE:TSCO), profiteering driving profit?

#SP500 #Japan225

The former boss of Sainsbury blamed Brexit for “horribly hurting” supermarkets, doubtless pausing his perusal of “Which Private Jet” to feed a clickbait headline. There can be little doubt UK supermarkets are guilty of profiteering at present, something anyone who’s been involved with retail will know. Even Lidl, while issuing a robust response to the accusation, failed to offer any defence to their price rises when presented with examples. At risk of going “Daily Mail”, they’re all at it.

Or are they?

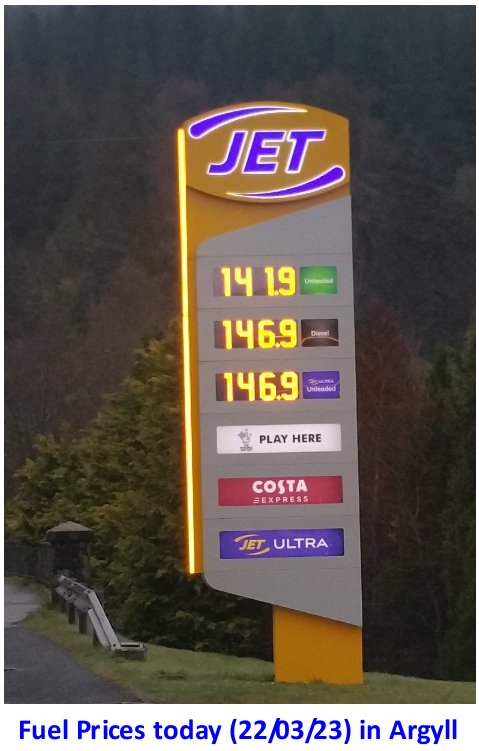
Folk who’ve been active in retail at a senior level learn fairly quickly how easy it is to make enhanced profits in time of turmoil. Oil tanker drivers on strike, forecourts closed? Record profits. Sugar shortages across the UK, record profits. Power cuts restricting trading hours, record profits. Hot weather causing ice cream shortages, record profits. The list is literally endless with Lockdown being a conspicuous exception to the rule. Except those business which survived are being afforded the chance to get away with boosting prices without any real criticism. One oddball to these scenario is our local petrol station here in Argyll, their forecourt prices proving sufficient to justify paying the return vehicle trip from the mainland. Their secret, a fabulous grocery section and a captive market where they quickly realise any error in pricing.

To be mildly ridiculous, when milk moved from £1.10 to £1.90 for the four pint cartons, folk stopped buying, the price came down. The first warning sign came on a Sunday evening, the dairy shelves usually an empty desert awaiting Mondays deliveries. But as the price was gouged upward, a frantic run to buy milk for the next days latte discovered shelves still full of product.


With Tesco, given their position as one of the leading profiteers in groceries and fuel, common sense demands we should anticipate continued record profits for the company, presumably with commensurate gains in the company share price. After all, “hope” tends prove to be a powerful aphrodisiac for traders who’ll cheerfully assume happy days are here to stay.

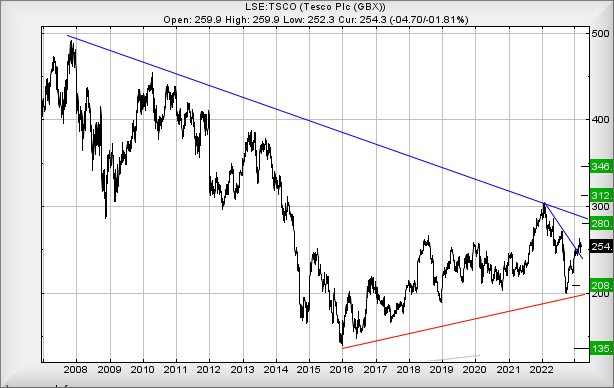
The immediate situation allows a scenario, where Tesco exceeding 264p should now trigger price growth to an initial 280p with our longer term secondary, if bettered, at a future 312p and price levels not seen since 2014. This game plan should be fascinating, even allowing for a third target level of 346p should Tesco prove sufficiently strong to close above the Blue downtrend.


For everything to go wrong, Tesco share price needs below Red on the chart as such a situation makes reversal to 135p exceedingly probable.

FUTURES

Time Issued Market Price At Issue Short Entry Fast Exit Slow Exit Stop Long Entry Fast Exit Slow Exit Stop Prior
9:41:27PM BRENT 75.59 ‘cess
9:43:19PM GOLD 1970.38 Success
9:46:30PM FTSE 7515.77
9:48:43PM STOX50 4161.3 ‘cess
9:51:38PM GERMANY 15116 Shambles
10:06:39PM US500 3945.62 3935 3909 3864 3977 4016 4019 4047 3994 Success
10:08:38PM DOW 32107 Shambles
10:11:00PM NASDAQ 12592 Success
10:12:52PM JAPAN 27245 27193 27105 26935 27380 27487 27527 27637 27380 ‘cess


22/03/2023 FTSE Closed at 7566 points. Change of 0.4%. Total value traded through LSE was: £ 5,173,752,790 a change of 1.87%
21/03/2023 FTSE Closed at 7536 points. Change of 1.8%. Total value traded through LSE was: £ 5,078,878,926 a change of -18.94%
20/03/2023 FTSE Closed at 7403 points. Change of 0.93%. Total value traded through LSE was: £ 6,265,515,535 a change of -57.61%
17/03/2023 FTSE Closed at 7335 points. Change of -1.01%. Total value traded through LSE was: £ 14,781,854,376 a change of 86.96%
16/03/2023 FTSE Closed at 7410 points. Change of 0.9%. Total value traded through LSE was: £ 7,906,260,016 a change of -5.19%
15/03/2023 FTSE Closed at 7344 points. Change of -3.84%. Total value traded through LSE was: £ 8,338,790,623 a change of 43.77%
14/03/2023 FTSE Closed at 7637 points. Change of 1.18%. Total value traded through LSE was: £ 5,799,952,343 a change of -34.08%

SUCCESS above means both FAST & SLOW targets were met. ‘CESS means just the FAST target met and probably the next time it is exceeded, movement to the SLOW target shall commence.

Our commentary is in two sections. Immediately below are today’s updated comments. If our commentary remains valid, the share can be found in the bottom section which has a RED heading. Hopefully, this will mean you no longer need to flip back through previous reports. HYPERLINKS DISABLED IN THIS VERSION

Please remember, all prices are mid-price (halfway between the Buy and Sell). When we refer to a price CLOSING above a specific level, we are viewing the point where we can regard a trend as changing. Otherwise, we are simply speculating on near term trading targets. Our website is www.trendsandtargets.com.

UPDATE. We often give an initial and a secondary price. If the initial is exceeded, we still expect it to fall back but the next time the initial is bettered, the price should continue to the secondary. The converse it true with price drops.

We can be contacted at info@trendsandtargets.com. Spam filters set to maximum so only legit emails get through…

Section One – Outlook Updated Today. Click here for Section Two – Outlook Remains Valid shares

Click Epic to jump to share: LSE:BARC Barclays** **LSE:BBY BALFOUR BEATTY** **LSE:CASP Caspian** **LSE:LLOY Lloyds Grp.** **LSE:NWG Natwest** **

********

Updated charts published on : Barclays, BALFOUR BEATTY, Lloyds Grp., Natwest,

LSE:BARC Barclays Close Mid-Price: 142.66 Percentage Change: -0.34% Day High: 147.84 Day Low: 140.68

Further movement against Barclays ABOVE 147.84 should improve acceleratio ……..

Subscribe for more

</p

View Previous Barclays & Big Picture ***

LSE:BBY BALFOUR BEATTY. Close Mid-Price: 364.8 Percentage Change: + 2.30% Day High: 376.4 Day Low: 355.8

All BALFOUR BEATTY needs are mid-price trades ABOVE 376.4 to improve acce ……..

Subscribe for more

</p

View Previous BALFOUR BEATTY & Big Picture ***

LSE:CASP Caspian. Close Mid-Price: 6.25 Percentage Change: + 0.81% Day High: 6.25 Day Low: 6.15

In the event Caspian experiences weakness below 6.15 it calculates with a ……..

Subscribe for more

</p

View Previous Caspian & Big Picture ***

LSE:LLOY Lloyds Grp. Close Mid-Price: 47.77 Percentage Change: -0.82% Day High: 49.04 Day Low: 47.7

All Lloyds Grp. needs are mid-price trades ABOVE 49.04 to improve acceler ……..

Subscribe for more

</p

View Previous Lloyds Grp. & Big Picture ***

LSE:NWG Natwest Close Mid-Price: 269.2 Percentage Change: -1.17% Day High: 280.2 Day Low: 269.5

Target met. Continued trades against NWG with a mid-price ABOVE 280.2 sho ……..

Subscribe for more

</p

View Previous Natwest & Big Picture ***

*** End of “Updated Today” comments on shares.

Taylor Wimpey Plc (LSE:TW.) and the path to 414p

#FTSE #Stoxx50 

Since 2008, Taylor Wimpey has done nothing particularly useful. Okay, we’ll concede their share price hit 4.28p during the Financial crisis, boosting to 240p in the period since, a pretty solid gain for the doubtless millions of traders who lie about these things, fondly remembering the ’56x bagger when they bought at the low and sold at the high. In fairness, most traders tend dwell on their mistakes and missed opportunities, rather than boast about the improbable.

The problem with Taylor Wimpey is fairly straightforward.

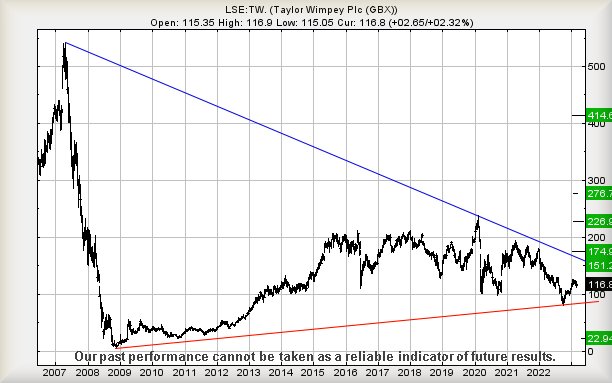
Their share price needs exceed 263p to convince us it has made a successful transit from the damage caused by the last major crash, entering a cycle where proper recovery is probable for the longer term. This is a share which topped out at 542p in 2007, is currently trading around 115p, and has essentially struggled during the last fifteen years. So, we’re effectively consigned to looking for any scenario which may boost their share above the 263p level!

How hard can it be as the ruling downtrend is only around 163.741p currently?

Now we think about it, perhaps it shall make more sense to look for reasons why the ruling downtrend may finally be exceeded…


The immediate situation demands trades above 125p to trigger share price recovery to an initial 151p and some possible hesitation. Should this level be exceeded, things become a tad more interesting for the longer term, our secondary calculating at 174p and the chance for the builders share price to close above Blue on the chart, laying foundations for future growth in the direction of 226p, maybe even beyond. And there you have it.

All Taylor Wimpey needs to enter a track to an eventual 414p is go up by 10p from current. If only life were so simple. This outpouring of optimism comes with a few inevitable pratt-falls. Glancing at the chart, the visuals imply a strong suggestion of some stutters at the 174p level, the reason being fairly obvious. During 2021, the share price struggled to exceed such a point and there are doubtless a bunch of folk who “invested” at these highs, just begging to get their cash back. Invariably, this will create selling pressure, introducing a hesitation in growth. But the smarter (gulp) traders will notice this time, it has achieved such a price level while trading above the ruling downtrend, resting on the optimistic side of the Blue line. Similarly, the high of 2020 shall doubtless introduce a stutter, should the 226p target appear and once again, all our usual reasons for hesitation apply.

But in this instance, due to “the risk” of substantial growth beyond 226p, closure above this price level invents a seriously good reason to view Taylor Wimpey as a reasonable long term hold.


Hopefully nothing such as a banking crisis provides sufficient excuse for this share price to close a session below 84p. Such an event risks triggering reversal to an ultimate bottom of 22p, doubtless an ideal level to open a Long position and hope for the best!


FUTURES

Time Issued Market Price At Issue Short Entry Fast Exit Slow Exit Stop Long Entry Fast Exit Slow Exit Stop Prior
9:36:11PM BRENT 74.92 ‘cess
9:39:38PM GOLD 1940.72 ‘cess
9:46:01PM FTSE 7558.72 7410 7370 7304 7450 7568 7604 7661 7495 Success
9:51:32PM STOX50 4199 4140 4132 4104 4188 4216 4228 4244 4194 ‘cess
9:53:39PM GERMANY 15265 ‘cess
9:55:52PM US500 4007.22 ‘cess
9:58:19PM DOW 32568.9 ‘cess
10:02:40PM JAPAN 27346
10:04:56PM NASDAQ 12742 Success


21/03/2023 FTSE Closed at 7536 points. Change of 1.8%. Total value traded through LSE was: £ 5,078,878,926 a change of -18.94%
20/03/2023 FTSE Closed at 7403 points. Change of 0.93%. Total value traded through LSE was: £ 6,265,515,535 a change of -57.61%
17/03/2023 FTSE Closed at 7335 points. Change of -1.01%. Total value traded through LSE was: £ 14,781,854,376 a change of 86.96%
16/03/2023 FTSE Closed at 7410 points. Change of 0.9%. Total value traded through LSE was: £ 7,906,260,016 a change of -5.19%
15/03/2023 FTSE Closed at 7344 points. Change of -3.84%. Total value traded through LSE was: £ 8,338,790,623 a change of 43.77%
14/03/2023 FTSE Closed at 7637 points. Change of 1.18%. Total value traded through LSE was: £ 5,799,952,343 a change of -34.08%
13/03/2023 FTSE Closed at 7548 points. Change of -2.58%. Total value traded through LSE was: £ 8,798,482,438 a change of 25.79%

SUCCESS above means both FAST & SLOW targets were met. ‘CESS means just the FAST target met and probably the next time it is exceeded, movement to the SLOW target shall commence.

Our commentary is in two sections. Immediately below are today’s updated comments. If our commentary remains valid, the share can be found in the bottom section which has a RED heading. Hopefully, this will mean you no longer need to flip back through previous reports. HYPERLINKS DISABLED IN THIS VERSION

Please remember, all prices are mid-price (halfway between the Buy and Sell). When we refer to a price CLOSING above a specific level, we are viewing the point where we can regard a trend as changing. Otherwise, we are simply speculating on near term trading targets. Our website is www.trendsandtargets.com.

UPDATE. We often give an initial and a secondary price. If the initial is exceeded, we still expect it to fall back but the next time the initial is bettered, the price should continue to the secondary. The converse it true with price drops.

We can be contacted at info@trendsandtargets.com. Spam filters set to maximum so only legit emails get through…

Section One – Outlook Updated Today. Click here for Section Two – Outlook Remains Valid shares

Click Epic to jump to share: LSE:AVCT Avacta** **LSE:BARC Barclays** **LSE:BLVN Bowleven** **LSE:BP. BP PLC** **LSE:CASP Caspian** **LSE:LLOY Lloyds Grp.** **LSE:NWG Natwest** **

********

Updated charts published on : Avacta, Barclays, Bowleven, Caspian, Lloyds Grp., Natwest,

LSE:AVCT Avacta. Close Mid-Price: 120 Percentage Change: + 0.00% Day High: 120.5 Day Low: 115

Weakness on Avacta below 115 will invariably lead to 97 with secondary, i ……..

Subscribe for more

</p

View Previous Avacta & Big Picture ***

LSE:BARC Barclays. Close Mid-Price: 143.14 Percentage Change: + 4.97% Day High: 145.1 Day Low: 138.76

All Barclays needs are mid-price trades ABOVE 145.1 to improve accelerati ……..

Subscribe for more

</p

View Previous Barclays & Big Picture ***

LSE:BLVN Bowleven Close Mid-Price: 1.25 Percentage Change: -9.09% Day High: 1.38 Day Low: 1.15

If Bowleven experiences continued weakness below 1.15, it will invariably ……..

Subscribe for more

</p

View Previous Bowleven & Big Picture ***

LSE:BP. BP PLC. Close Mid-Price: 503.4 Percentage Change: + 3.37% Day High: 508.4 Day Low: 489.9

In the event of BP PLC enjoying further trades beyond 508.4, the share sh ……..

Subscribe for more

</p

View Previous BP PLC & Big Picture ***

LSE:CASP Caspian Close Mid-Price: 6.2 Percentage Change: -1.59% Day High: 6.3 Day Low: 6.2

All Caspian needs are mid-price trades ABOVE 6.3 to improve acceleration ……..

Subscribe for more

</p

View Previous Caspian & Big Picture ***

LSE:LLOY Lloyds Grp.. Close Mid-Price: 48.16 Percentage Change: + 4.46% Day High: 48.53 Day Low: 46.65

In the event of Lloyds Grp. enjoying further trades beyond 48.53, the sha ……..

Subscribe for more

</p

View Previous Lloyds Grp. & Big Picture ***

LSE:NWG Natwest. Close Mid-Price: 272.4 Percentage Change: + 5.66% Day High: 276.7 Day Low: 261.2

All Natwest needs are mid-price trades ABOVE 276.7 to improve acceleratio ……..

Subscribe for more

</p

View Previous Natwest & Big Picture ***

*** End of “Updated Today” comments on shares.

Shanta Gold Ltd (LSE:SHG) looking good.

#Gold #Nasdaq

Inevitably, following the discovery of a single flake of gold on a beach at a local river, there was an driving urge to view a Gold share to inspect the market potentials. To come clean, the same beach featured on todays dog walk, unearthing a few other golden flakes with close inspection of a layer of black sand, an area where gold allegedly likes to hide.

It looks very like permission shall be sought from the farmer/landowner to try my luck with a gold panning kit, a very rarely used present from years ago, one of these joke birthday presents men of a certain age tend be presented with every year. It’s currently in the garden shed, at the very back and under a pile of untouched  fishing gear. After all, Scotgold here in Argyll claim to have around 4 tons of gold inside a mountain, their share price constantly failing to reflect any optimism.

However, Shanta Gold appear to be exhibiting some potentials, doubtless related to the constant little nudges upward the US dollar price of gold is experiencing. Currently, we can argue the Big Picture for Gold suggests $2125 as a viable longer term target. Or perhaps it’s to do with the undoubted slick photo’s of their gold extraction operation on their website. As someone addicted to Gold Rush and Bering Sea Gold on telly, the layout of Shanta’s operation makes the North American operations look like heavy machinery scrap yard’s trying to do something else.


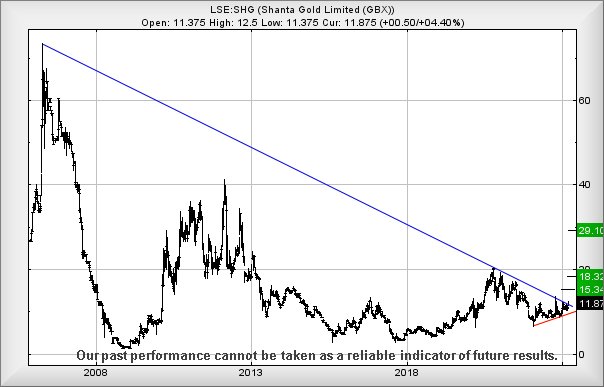
At present, it looks like Shanta need only close a session above 12p to enter a movement cycle toward an initial 15.3p with secondary, if exceeded, calculating at an important 18.3p. Closure above 18.3p shall be regarded as important for the future, making a longer term 29p a viable proposition. Given the share price is presently trading around 11.8p, it certainly doesn’t need work hard to enact a fairly optimistic breakout for the future.

Their share price needs dig a hole below 9p to suggest trouble approaching, closing a session below Red on the chart and spoiling all our previous calculations.

For now, we suspect Shanta will prove worth watching.

FUTURES

Time Issued Market Price At Issue Short Entry Fast Exit Slow Exit Stop Long Entry Fast Exit Slow Exit Stop Prior
12:05:41AM BRENT 73.35 Shambles
12:16:54AM GOLD 1979.47 1965 1947 1926 1986 2011 2018 2037 1987 Success
12:19:03AM FTSE 7421.84 Shambles
12:20:51AM STOX50 4148.3 Success
12:23:57AM GERMANY 15021.97 Success
12:26:38AM US500 3967.5 Success
12:28:33AM DOW 32330
12:30:19AM NASDAQ 12602 12512 12479 12434 12577 12612 12662 12748 12512
12:32:39AM JAPAN 27176


20/03/2023 FTSE Closed at 7403 points. Change of 0.93%. Total value traded through LSE was: £ 6,265,515,535 a change of -57.61%
17/03/2023 FTSE Closed at 7335 points. Change of -1.01%. Total value traded through LSE was: £ 14,781,854,376 a change of 86.96%
16/03/2023 FTSE Closed at 7410 points. Change of 0.9%. Total value traded through LSE was: £ 7,906,260,016 a change of -5.19%
15/03/2023 FTSE Closed at 7344 points. Change of -3.84%. Total value traded through LSE was: £ 8,338,790,623 a change of 43.77%
14/03/2023 FTSE Closed at 7637 points. Change of 1.18%. Total value traded through LSE was: £ 5,799,952,343 a change of -34.08%
13/03/2023 FTSE Closed at 7548 points. Change of -2.58%. Total value traded through LSE was: £ 8,798,482,438 a change of 25.79%
10/03/2023 FTSE Closed at 7748 points. Change of -1.66%. Total value traded through LSE was: £ 6,994,694,563 a change of 6.35%

SUCCESS above means both FAST & SLOW targets were met. ‘CESS means just the FAST target met and probably the next time it is exceeded, movement to the SLOW target shall commence.

Our commentary is in two sections. Immediately below are today’s updated comments. If our commentary remains valid, the share can be found in the bottom section which has a RED heading. Hopefully, this will mean you no longer need to flip back through previous reports. HYPERLINKS DISABLED IN THIS VERSION

Please remember, all prices are mid-price (halfway between the Buy and Sell). When we refer to a price CLOSING above a specific level, we are viewing the point where we can regard a trend as changing. Otherwise, we are simply speculating on near term trading targets. Our website is www.trendsandtargets.com.

UPDATE. We often give an initial and a secondary price. If the initial is exceeded, we still expect it to fall back but the next time the initial is bettered, the price should continue to the secondary. The converse it true with price drops.

We can be contacted at info@trendsandtargets.com. Spam filters set to maximum so only legit emails get through…

Section One – Outlook Updated Today. Click here for Section Two – Outlook Remains Valid shares

Click Epic to jump to share: LSE:AML Aston Martin** **LSE:ASC Asos** **LSE:AV. Aviva** **LSE:AVCT Avacta** **LSE:BARC Barclays** **LSE:BP. BP PLC** **LSE:CCL Carnival** **LSE:GENL Genel** **LSE:GKP Gulf Keystone** **LSE:IAG British Airways** **LSE:IGG IG Group** **LSE:LLOY Lloyds Grp.** **LSE:MMAG Music Magpie** **LSE:NWG Natwest** **LSE:SMT Scottish Mortgage Investment Trust** **LSE:SPT Spirent Comms** **LSE:STAN Standard Chartered** **LSE:TLW Tullow** **

********

Updated charts published on : Aston Martin, Asos, Aviva, Avacta, Barclays, BP PLC, Carnival, Genel, Gulf Keystone, British Airways, IG Group, Lloyds Grp., Music Magpie, Natwest, Scottish Mortgage Investment Trust, Spirent Comms, Standard Chartered, Tullow,

LSE:AML Aston Martin Close Mid-Price: 231.1 Percentage Change: -0.52% Day High: 245.1 Day Low: 216.5

If Aston Martin experiences continued weakness below 216, it will invariab ……..

Subscribe for more

</p

View Previous Aston Martin & Big Picture ***

LSE:ASC Asos Close Mid-Price: 722 Percentage Change: -2.10% Day High: 737 Day Low: 686.5

Target Met. Below 686 presents a scenario giving reversal to an initial 59 ……..

Subscribe for more

</p

View Previous Asos & Big Picture ***

LSE:AV. Aviva. Close Mid-Price: 411.6 Percentage Change: + 2.34% Day High: 414.7 Day Low: 383.6

Target Met. 17/03/2023: If Aviva experiences continued weakness below 383 ……..

Subscribe for more

</p

View Previous Aviva & Big Picture ***

LSE:AVCT Avacta Close Mid-Price: 120 Percentage Change: -7.55% Day High: 128.5 Day Low: 119

Target Met. Hopefully there shall be a bounce from the current level as th ……..

Subscribe for more

</p

View Previous Avacta & Big Picture ***

LSE:BARC Barclays Close Mid-Price: 136.36 Percentage Change: -2.29% Day High: 138.04 Day Low: 128.16

Target Met. Now below 128 threatens reversal to 124 next with secondary, i ……..

Subscribe for more

</p

View Previous Barclays & Big Picture ***

LSE:BP. BP PLC. Close Mid-Price: 487 Percentage Change: + 1.47% Day High: 492.5 Day Low: 467.1

Now below 467 indicates the risk of ongoing reversal to 438 with secondary ……..

Subscribe for more

</p

View Previous BP PLC & Big Picture ***

LSE:CCL Carnival Close Mid-Price: 630.2 Percentage Change: -0.72% Day High: 647.8 Day Low: 612

Below 612 remains on course for reversal to 519 with secondary, if broken, ……..

Subscribe for more

</p

View Previous Carnival & Big Picture ***

LSE:GENL Genel Close Mid-Price: 111.4 Percentage Change: -1.76% Day High: 114 Day Low: 112

Below 111 indicates reversal potentials to an initial 104 with secondary, ……..

Subscribe for more

</p

View Previous Genel & Big Picture ***

LSE:GKP Gulf Keystone Close Mid-Price: 170.8 Percentage Change: -0.23% Day High: 171.4 Day Low: 161.2

Below 161 still suggests a potential for reversal to 151 with secondary, i ……..

Subscribe for more

</p

View Previous Gulf Keystone & Big Picture ***

LSE:IAG British Airways. Close Mid-Price: 137.66 Percentage Change: + 3.30% Day High: 139.28 Day Low: 127.8

Target Met. This needs above 145 to make some sense, allowing recovery to ……..

Subscribe for more

</p

View Previous British Airways & Big Picture ***

LSE:IGG IG Group. Close Mid-Price: 692 Percentage Change: + 2.75% Day High: 694 Day Low: 658.5

Weakness on IG Group below 658 will invariably lead to 645 with secondary ……..

Subscribe for more

</p

View Previous IG Group & Big Picture ***

LSE:LLOY Lloyds Grp. Close Mid-Price: 46.1 Percentage Change: -0.31% Day High: 46.73 Day Low: 43.69

Now below 43.6 indicates the potential of reversal to an initial 43.1 with ……..

Subscribe for more

</p

View Previous Lloyds Grp. & Big Picture ***

LSE:MMAG Music Magpie. Close Mid-Price: 26.6 Percentage Change: + 5.14% Day High: 26.6 Day Low: 23.1

Weakness now below 23 suggests coming travel to an initial 17p with second ……..

Subscribe for more

</p

View Previous Music Magpie & Big Picture ***

LSE:NWG Natwest Close Mid-Price: 257.8 Percentage Change: -0.08% Day High: 259.8 Day Low: 237.2

Target Met. In the unlikely even this trips below 237p, reversal to an ini ……..

Subscribe for more

</p

View Previous Natwest & Big Picture ***

LSE:SMT Scottish Mortgage Investment Trust Close Mid-Price: 662.2 Percentage Change: -1.34% Day High: 666 Day Low: 649

Target Met. Now needing above 738 to make any recovery appear viable, such ……..

Subscribe for more

</p

View Previous Scottish Mortgage Investment Trust & Big Picture ***
LSE:SPT Spirent Comms. Close Mid-Price: 170.2 Percentage Change: + 0.89% Day High: 170.2 Day Low: 164.6

This isn’t looking great as continued traffic below 164 still indicates a ……..

Subscribe for more

</p

View Previous Spirent Comms & Big Picture ***

LSE:STAN Standard Chartered Close Mid-Price: 615 Percentage Change: -3.00% Day High: 619 Day Low: 578.8

Traffic continuing below 578 now points at 536 next with secondary, if bro ……..

Subscribe for more

</p

View Previous Standard Chartered & Big Picture ***

LSE:TLW Tullow Close Mid-Price: 27.6 Percentage Change: -4.63% Day High: 29.66 Day Low: 26.18

Now below 26 has the potential for reversal to 22 with secondary, if broke ……..

Subscribe for more

</p

View Previous Tullow & Big Picture ***

*** End of “Updated Today” comments on shares.