#FTSE #Stoxx50
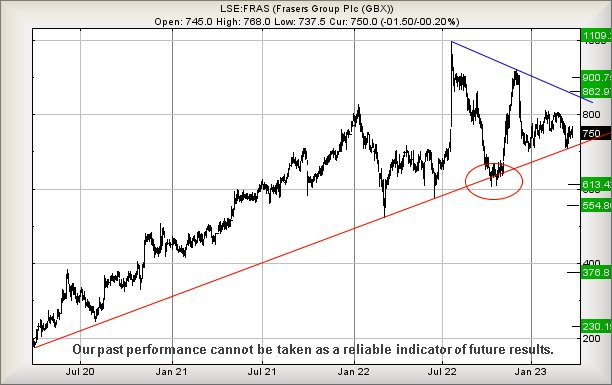
We can be a little paranoid about warning signs against share price movements. For instance, the image below for clothing retailer, Frasers Group Plc, displays a bit of a stunner, something which actually makes some sense when you think about it. BP actually had something pretty similar, prior to Deepwater Horizon, and aAlso, Wall St experienced a dip below the uptrend, prior to events in Sept 2001. It’s got nothing to do with the markets being prescient.
This sort of thing happens all the time, a solid uptrend breaking and we suspect all it implies is the potential for weakness in a price movement, essentially the market broadcasting “this trend in no sacred, it can break!” However, should a share price move below the level of a historical ‘warning’ break of a trend, it’s definitely the time to jog along to your local Sports Direct and buy running shoes as a worst case scenario may be about to come true.
As an aside, the Frasers Group of today really have nothing in common with the historical House of Fraser in Glasgow, a company formed around 170 years ago and the subject of utter dread every December in the 1970’s. For some reason, always designated as my mothers official bag carrier, spending hours in the awful place buying Xmas gifts for everyone (except me) left only a memory of the utter stink of perfume. The perfume department was on the ground floor, a vastly overheated area with the samples smell permeating upward to contaminate the entire massive store and we’d finally leave, me with a headache, safe in the knowledge I’d once again be getting Book and Music shop vouchers. This wasn’t a shop which generated fond memories for this particular child.
In the case of Frasers Group share price currently, the Red uptrend has been confirmed multiple times since 2020.
Should early signals for trouble be needed, share price closure below 720 looks capable of breaking Red and promoting weakness to a non threatening 613p with secondary, if broken, a rather nasty looking 554p. As we alluded earlier, anything capable of bringing a share price below the circled Red trend break value is liable to be quite dangerous, taking the share price into a zone where a sharp reversal cycle to 376, perhaps even a bottom of 230p becomes probable.
In the event Frasers Group intends an emergency escape from this troubling picture, share price movements above just 807p calculate with the chances of a lift to 862p next with secondary, if beaten, at 900p and an expectation of some hesitation. From our perspective, the share price needs closure above 900p to suggest considerable strength has entered the fray and a future exists which may not stink!
FUTURES
| Time Issued | Market | Price At Issue | Short Entry | Fast Exit | Slow Exit | Stop | Long Entry | Fast Exit | Slow Exit | Stop | Prior |
| 9:41:35PM | BRENT | 78.45 | ‘cess | ||||||||
| 9:44:25PM | GOLD | 1974.02 | |||||||||
| 9:46:57PM | FTSE | 7470.72 | 7449 | 7435 | 7405 | 7488 | 7503 | 7515 | 7537 | 7477 | |
| 9:48:40PM | STOX50 | 4173.3 | 4153 | 4131 | 4104 | 4178 | 4212 | 4228 | 4275 | 4171 | |
| 10:05:52PM | GERMANY | 15142.15 | |||||||||
| 10:08:03PM | US500 | 3977.09 | ‘cess | ||||||||
| 10:10:03PM | DOW | 32425.6 | |||||||||
| 10:12:01PM | NASDAQ | 12629 | Success | ||||||||
| 10:17:04PM | JAPAN | 27496 | ‘cess |
28/03/2023 FTSE Closed at 7484 points. Change of 0.17%. Total value traded through LSE was: £ 6,680,856,903 a change of 37.06%
27/03/2023 FTSE Closed at 7471 points. Change of 0.89%. Total value traded through LSE was: £ 4,874,298,034 a change of -13.9%
24/03/2023 FTSE Closed at 7405 points. Change of -1.25%. Total value traded through LSE was: £ 5,661,322,709 a change of -17%
23/03/2023 FTSE Closed at 7499 points. Change of -0.89%. Total value traded through LSE was: £ 6,821,003,257 a change of 31.84%
22/03/2023 FTSE Closed at 7566 points. Change of 0.4%. Total value traded through LSE was: £ 5,173,752,790 a change of 1.87%
21/03/2023 FTSE Closed at 7536 points. Change of 1.8%. Total value traded through LSE was: £ 5,078,878,926 a change of -18.94%
20/03/2023 FTSE Closed at 7403 points. Change of 0.93%. Total value traded through LSE was: £ 6,265,515,535 a change of -57.61%
SUCCESS above means both FAST & SLOW targets were met. ‘CESS means just the FAST target met and probably the next time it is exceeded, movement to the SLOW target shall commence.
Our commentary is in two sections. Immediately below are today’s updated comments. If our commentary remains valid, the share can be found in the bottom section which has a RED heading. Hopefully, this will mean you no longer need to flip back through previous reports. HYPERLINKS DISABLED IN THIS VERSION
Please remember, all prices are mid-price (halfway between the Buy and Sell). When we refer to a price CLOSING above a specific level, we are viewing the point where we can regard a trend as changing. Otherwise, we are simply speculating on near term trading targets. Our website is www.trendsandtargets.com.
UPDATE. We often give an initial and a secondary price. If the initial is exceeded, we still expect it to fall back but the next time the initial is bettered, the price should continue to the secondary. The converse it true with price drops.
We can be contacted at info@trendsandtargets.com. Spam filters set to maximum so only legit emails get through…
Section One – Outlook Updated Today. Click here for Section Two – Outlook Remains Valid shares
Click Epic to jump to share: LSE:BP. BP PLC** **LSE:CASP Caspian** **LSE:CCL Carnival** **LSE:GKP Gulf Keystone** **LSE:ITM ITM Power** **LSE:RBD Reabold Resources PLC** **LSE:SMT Scottish Mortgage Investment Trust** **
********
Updated charts published on : BP PLC, Caspian, Carnival, Gulf Keystone, ITM Power, Reabold Resources PLC, Scottish Mortgage Investment Trust,
LSE:BP. BP PLC. Close Mid-Price: 507.8 Percentage Change: + 2.30% Day High: 510.5 Day Low: 503.1
Further movement against BP PLC ABOVE 510.5 should improve acceleration t ……..
</p
View Previous BP PLC & Big Picture ***
LSE:CASP Caspian Close Mid-Price: 6.2 Percentage Change: -3.88% Day High: 6.45 Day Low: 6.1
Weakness on Caspian below 6.1 will invariably lead to 5.25 with secondary ……..
</p
View Previous Caspian & Big Picture ***
LSE:CCL Carnival. Close Mid-Price: 664.6 Percentage Change: + 1.84% Day High: 676.8 Day Low: 629
Continued weakness against CCL taking the price below 629 calculates as l ……..
</p
View Previous Carnival & Big Picture ***
LSE:GKP Gulf Keystone. Close Mid-Price: 158 Percentage Change: + 9.42% Day High: 161.8 Day Low: 144.8
This is getting a bit interesting as above 162 looks like it has the poten ……..
</p
View Previous Gulf Keystone & Big Picture ***
LSE:ITM ITM Power Close Mid-Price: 69.42 Percentage Change: -4.67% Day High: 73.5 Day Low: 69.26
If ITM Power experiences continued weakness below 69.26, it will invariab ……..
</p
View Previous ITM Power & Big Picture ***
LSE:RBD Reabold Resources PLC Close Mid-Price: 0.18 Percentage Change: -1.33% Day High: 0.19 Day Low: 0.18
Continued weakness against RBD taking the price below 0.18 calculates as ……..
</p
View Previous Reabold Resources PLC & Big Picture ***
LSE:SMT Scottish Mortgage Investment Trust Close Mid-Price: 643 Percentage Change: -1.14% Day High: 652.8 Day Low: 641.6
Target met. In the event Scottish Mortgage Investment Trust experiences w ……..
</p
View Previous Scottish Mortgage Investment Trust & Big Picture ***