#Gold #SP500
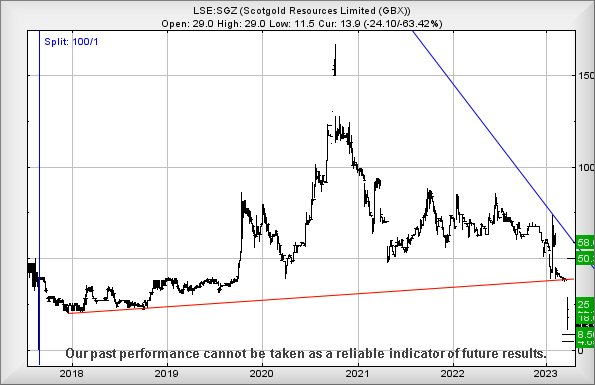
Regular readers will know of our utter distaste for negative share splits, price movements designed to make a share sound more respectable. Often, for the longer term, whatever culture permeated a company, causing any initial share split, remains, creating the same situation again. Scotgold in Tyndrum, guilty of 100:1 surgery in 2017, saw their share price boost from around 0.4p up to a pretend 40p in a blink.
The manoeuvre, we’ll take 100 of your shares and give you a brand new single shiny one back, rarely seems to work out for the longer term, victims from prior to the share split being the ones who obviously pay. For instance, folk from 2012 “only” need see Scotgold move above 6 quid until they find themselves in profit. Glancing at the chart below, it’s easy to suspect Scotgold may soon consider yet another share split as the immediate future looks pretty vile.
Movement next below 11.5p looks very capable of a trip down to 8.5p next, perhaps with a bounce. Our secondary, if such a level breaks, works out at just 4p, a price level below which we cannot calculate as every target gets prefaced with a minus sign.
In the event any miracles are planned (it is nearly Easter) apparently the share price only needs exceed 15.5 to make an attempt at 18 next with our secondary, if bettered, at 22p (which may be 25p, thanks to the market gapping the price down. Unfortunately, this feels like it has similar quality to a dead cat bounce, none of the targets coming close to 32p, above which the market would be forced to concede it was all a dreadful mistake.
We fear, despite Gold prices being at record high levels, Scotlands Gold miner intends drill down to the 4p level and hopefully shall discover an excuse for the market to gap the share price up substantially. Currently we’re lacking optimism, suspecting the market doesn’t inflict a minus 63% day without good reason. Perhaps the Earnings Report due later this week shall contain good news…
FUTURES
| Time Issued | Market | Price At Issue | Short Entry | Fast Exit | Slow Exit | Stop | Long Entry | Fast Exit | Slow Exit | Stop | Prior |
| 9:50:36PM | BRENT | 77.79 | Success | ||||||||
| 9:53:19PM | GOLD | 1956.21 | 1943 | 1929 | 1925 | 1959 | 1978 | 1987 | 2002 | 1963 | Success |
| 9:55:14PM | FTSE | 7510.52 | ‘cess | ||||||||
| 9:57:25PM | STOX50 | 4185 | |||||||||
| 9:59:45PM | GERMANY | 15187 | |||||||||
| 10:01:59PM | US500 | 3988 | 3969 | 3955 | 3938 | 3990 | 4006 | 4013 | 4026 | 3986 | ‘cess |
| 10:25:46PM | DOW | 32484 | Success | ||||||||
| 10:27:44PM | NASDAQ | 12696 | |||||||||
| 10:29:52PM | JAPAN | 27591 | ‘cess |
27/03/2023 FTSE Closed at 7471 points. Change of 0.89%. Total value traded through LSE was: £ 4,874,298,034 a change of -13.9%
24/03/2023 FTSE Closed at 7405 points. Change of -1.25%. Total value traded through LSE was: £ 5,661,322,709 a change of -17%
23/03/2023 FTSE Closed at 7499 points. Change of -0.89%. Total value traded through LSE was: £ 6,821,003,257 a change of 31.84%
22/03/2023 FTSE Closed at 7566 points. Change of 0.4%. Total value traded through LSE was: £ 5,173,752,790 a change of 1.87%
21/03/2023 FTSE Closed at 7536 points. Change of 1.8%. Total value traded through LSE was: £ 5,078,878,926 a change of -18.94%
20/03/2023 FTSE Closed at 7403 points. Change of 0.93%. Total value traded through LSE was: £ 6,265,515,535 a change of -57.61%
17/03/2023 FTSE Closed at 7335 points. Change of -1.01%. Total value traded through LSE was: £ 14,781,854,376 a change of 86.96%
SUCCESS above means both FAST & SLOW targets were met. ‘CESS means just the FAST target met and probably the next time it is exceeded, movement to the SLOW target shall commence.
Our commentary is in two sections. Immediately below are today’s updated comments. If our commentary remains valid, the share can be found in the bottom section which has a RED heading. Hopefully, this will mean you no longer need to flip back through previous reports. HYPERLINKS DISABLED IN THIS VERSION
Please remember, all prices are mid-price (halfway between the Buy and Sell). When we refer to a price CLOSING above a specific level, we are viewing the point where we can regard a trend as changing. Otherwise, we are simply speculating on near term trading targets. Our website is www.trendsandtargets.com.
UPDATE. We often give an initial and a secondary price. If the initial is exceeded, we still expect it to fall back but the next time the initial is bettered, the price should continue to the secondary. The converse it true with price drops.
We can be contacted at info@trendsandtargets.com. Spam filters set to maximum so only legit emails get through…
Section One – Outlook Updated Today. Click here for Section Two – Outlook Remains Valid shares
Click Epic to jump to share: LSE:BBY BALFOUR BEATTY** **LSE:CCL Carnival** **LSE:EME Empyrean** **LSE:GENL Genel** **LSE:GKP Gulf Keystone** **LSE:ITM ITM Power** **LSE:QFI Quadrise** **
********
Updated charts published on : BALFOUR BEATTY, Carnival, Empyrean, Genel, Gulf Keystone, ITM Power, Quadrise,
LSE:BBY BALFOUR BEATTY. Close Mid-Price: 376 Percentage Change: + 1.29% Day High: 379.2 Day Low: 373.6
Continued trades against BBY with a mid-price ABOVE 379.2 should improve ……..
</p
View Previous BALFOUR BEATTY & Big Picture ***
LSE:CCL Carnival. Close Mid-Price: 652.6 Percentage Change: + 0.00% Day High: 700 Day Low: 647.4
Weakness on Carnival below 647.4 will invariably lead to 600 and hopefull ……..
</p
View Previous Carnival & Big Picture ***
LSE:EME Empyrean Close Mid-Price: 1.05 Percentage Change: -4.56% Day High: 0 Day Low: 0
In the event Empyrean experiences weakness below 1.05 it calculates with ……..
</p
View Previous Empyrean & Big Picture ***
LSE:GENL Genel Close Mid-Price: 110 Percentage Change: -6.30% Day High: 114 Day Low: 98.6
Target met. If Genel experiences continued weakness below 98.6, it will i ……..
</p
View Previous Genel & Big Picture ***
LSE:GKP Gulf Keystone Close Mid-Price: 144.4 Percentage Change: -16.72% Day High: 169.2 Day Low: 130.2
Target met. Weakness on Gulf Keystone below 130.2 will invariably lead to ……..
</p
View Previous Gulf Keystone & Big Picture ***
LSE:ITM ITM Power Close Mid-Price: 72.82 Percentage Change: -2.98% Day High: 78.52 Day Low: 72.86
Continued weakness against ITM taking the price below 72.86 calculates as ……..
</p
View Previous ITM Power & Big Picture ***
LSE:QFI Quadrise Close Mid-Price: 1.52 Percentage Change: -7.89% Day High: 1.6 Day Low: 1.5
This is starting to have the potential of being mildly interesting, needin ……..
</p
View Previous Quadrise & Big Picture ***