#FTSE #GOLD
I always had a soft spot for Radio 2’s Ken Bruce, if only because we attended the same primary school, tho’ quite a few years apart. His popular Popmaster quiz show had a question section, asking callers to name the year when something charted. Inevitably, callers were wrong, prompting the show host to utter “One Year Out!”, something which became a catchphrase.
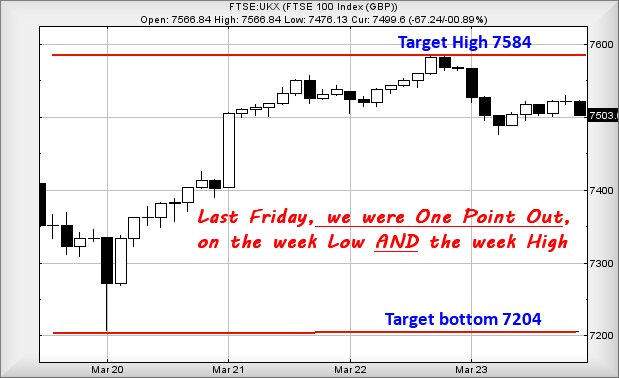
Last weeks FTSE for Friday enacted something similar for ourselves, the potential Short position bouncing from 7205 points on Monday, whereas our secondary target was 7204 points. One Point Out and perhaps the bounce slightly above the 206 point drop implied the potential for strength, even though it was just one point.
And then came Wednesday…
Wednesday decided to trigger our converse Long scenario for the FTSE, the session successfully topping out at 7585 points. Our secondary target had been 7584 points. Again, One Point Out and a successful gain of 174 points. Perhaps, by beating our gain target by a single point, it also implies the potential for strength.
The mad thing is, last Friday we successfully managed to define both the Low and the High for the coming week, something which wasn’t really our intention. But in producing targets for the near future, the ugly issue of time always appears. We always feel timeframes are a pretty major issue, whereas numbers rarely lie and simply open the door for patience. The aim in our Friday column is to look at both the Big Picture and immediate picture, trying to discover areas where both scenario create similar target levels. With this method, about the best we dare hope is a “within living memory” approach, one which thankfully works out fairly reliably.
But this is certainly the first time we can remember defining the highs and lows of a week on the market. Of course, we’re a little nervous decreeing strength is now upon as “One Point Out” doesn’t present the most confident argument of strength for the future, thanks to a single point only representing 0.13% of movement from a 7410 starting point!
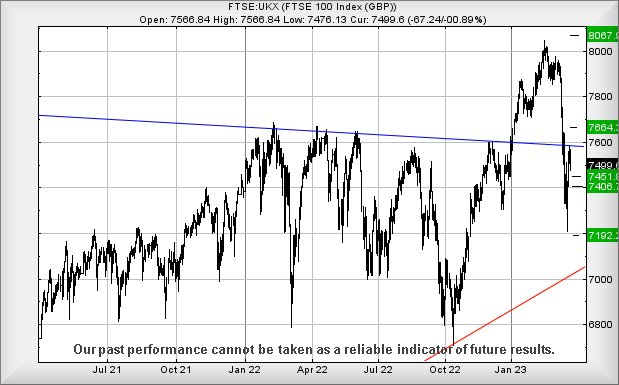
Importantly, the FTSE still has not managed to regain a place above the Blue downtrend since 2018, a pity as this would be almost a “no brainer” signal to imply a cycle upward is expected. The immediate picture presents a scenario, where movement next above 7592 looks capable of dragging the index upward to an initial 7664 points with secondary, if bettered, an impressive 8067 points. If triggered, the market will require to slither below 7500 to make it suddenly unlikely. Maybe it all depends on whether the market intends to trap the FTSE within the Red tramlines on the chart above.
Our converse scenario for a short position actually looks more likely.
Trouble now below 7475 points should prove capable of triggering reversal to an initial 7451 points with secondary, if broken, down at 7406 points. Neither reversal potential “sticks the boot in” but there’s a serious issue if our secondary breaks as a visit to 7192 calculates as possible!
Have a good weekend. No Formula 1, so expect a boring one.
FUTURES
| Time Issued | Market | Price At Issue | Short Entry | Fast Exit | Slow Exit | Stop | Long Entry | Fast Exit | Slow Exit | Stop | Prior |
| 9:51:42PM | BRENT | 75.26 | 74.76 | 74.565 | 75.9 | 77.16 | 77.725 | 75.82 | |||
| 9:54:37PM | GOLD | 1994.1 | 1963 | 1949 | 1984 | 2004 | 2011 | 1988 | ‘cess | ||
| 9:56:49PM | FTSE | 7455.9 | 7412 | 7367 | 7465 | 7463 | 7475 | 7428 | ‘cess | ||
| 9:59:12PM | STOX50 | 4181.3 | 4154 | 4148 | 4182 | 4218 | 4246 | 4173 | Shambles | ||
| 10:03:50PM | GERMANY | 15144 | 15007 | 14950 | 15159 | 15159 | 15223 | 15113 | ‘cess | ||
| 10:06:43PM | US500 | 3955.84 | 3936 | 3911 | 3955 | 3986 | 4008 | 3957 | |||
| 10:43:11PM | DOW | 32118 | 31832 | 31618 | 32170 | 32247 | 32400 | 32061 | |||
| 10:45:15PM | NASDAQ | 12710 | 12584 | 12442 | 12750 | 12814 | 12865 | 12710 | |||
| 10:47:01PM | JAPAN | 27316 | 27168 | 27105 | 27370 | 27389 | 27476 | 27305 |
23/03/2023 FTSE Closed at 7499 points. Change of -0.89%. Total value traded through LSE was: £ 6,821,003,257 a change of 31.84%
22/03/2023 FTSE Closed at 7566 points. Change of 0.4%. Total value traded through LSE was: £ 5,173,752,790 a change of 1.87%
21/03/2023 FTSE Closed at 7536 points. Change of 1.8%. Total value traded through LSE was: £ 5,078,878,926 a change of -18.94%
20/03/2023 FTSE Closed at 7403 points. Change of 0.93%. Total value traded through LSE was: £ 6,265,515,535 a change of -57.61%
17/03/2023 FTSE Closed at 7335 points. Change of -1.01%. Total value traded through LSE was: £ 14,781,854,376 a change of 86.96%
16/03/2023 FTSE Closed at 7410 points. Change of 0.9%. Total value traded through LSE was: £ 7,906,260,016 a change of -5.19%
15/03/2023 FTSE Closed at 7344 points. Change of -3.84%. Total value traded through LSE was: £ 8,338,790,623 a change of 43.77%
SUCCESS above means both FAST & SLOW targets were met. ‘CESS means just the FAST target met and probably the next time it is exceeded, movement to the SLOW target shall commence.
Our commentary is in two sections. Immediately below are today’s updated comments. If our commentary remains valid, the share can be found in the bottom section which has a RED heading. Hopefully, this will mean you no longer need to flip back through previous reports. HYPERLINKS DISABLED IN THIS VERSION
Please remember, all prices are mid-price (halfway between the Buy and Sell). When we refer to a price CLOSING above a specific level, we are viewing the point where we can regard a trend as changing. Otherwise, we are simply speculating on near term trading targets. Our website is www.trendsandtargets.com.
UPDATE. We often give an initial and a secondary price. If the initial is exceeded, we still expect it to fall back but the next time the initial is bettered, the price should continue to the secondary. The converse it true with price drops.
We can be contacted at info@trendsandtargets.com. Spam filters set to maximum so only legit emails get through…
Section One – Outlook Updated Today. Click here for Section Two – Outlook Remains Valid shares
Click Epic to jump to share: LSE:AML Aston Martin** **LSE:AVCT Avacta** **LSE:CCL Carnival** **LSE:SMT Scottish Mortgage Investment Trust** **
********
Updated charts published on : Aston Martin, Avacta, Carnival, Scottish Mortgage Investment Trust,
LSE:AML Aston Martin Close Mid-Price: 221.9 Percentage Change: -0.89% Day High: 228 Day Low: 217.3
Below 216 still indicates 213 with some bounce potentials but, if broken, ……..
</p
View Previous Aston Martin & Big Picture ***
LSE:AVCT Avacta Close Mid-Price: 112.5 Percentage Change: -5.06% Day High: 117.5 Day Low: 111
Continued weakness against AVCT taking the price below 111 calculates as ……..
</p
View Previous Avacta & Big Picture ***
LSE:CCL Carnival. Close Mid-Price: 669.6 Percentage Change: + 0.27% Day High: 686 Day Low: 650.8
Movement now below 650 suggests coming weakness to 600 and hopefully a bou ……..
</p
View Previous Carnival & Big Picture ***
LSE:SMT Scottish Mortgage Investment Trust. Close Mid-Price: 670 Percentage Change: + 2.17% Day High: 670.8 Day Low: 643.8
If Scottish Mortgage Investment Trust experiences continued weakness belo ……..
</p
View Previous Scottish Mortgage Investment Trust & Big Picture ***