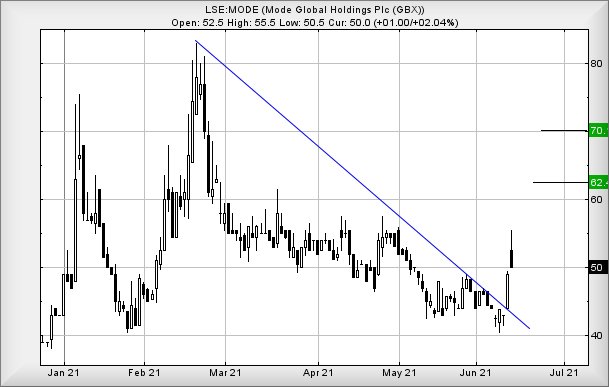
#Gold #WallSt Mode Global appear to be a company in the right place at the right time. Formed just a few years ago, their stated aim is to ‘become a financial services business delivering the products of tomorrow, today’. Their website is alive with current buzzwords and even the classic ‘fintech’ is now presented with a capital ‘F’, obviously continuing attempts to make Fintech a real word. In fairness, it should be as one of the earlier components of the Fintech field, PayPal, continue to perform quite nicely.
Our eyebrows were raised, reading Mode Global are already in partnership with Tencent and Alibaba, both quite big deals.
Fintech, very basically, can be thought of as ongoing (successful) attempts to replace credit card companies as the method for online purchases. In this arena, Paypal can obviously take a bow, but the potentials continue to be discovered. Today, watching someone pay at a checkout by using their smartphone, was just another application where financial technology is increasingly used. No credit cards nor debit cards were harmed in the process, a single act which must be truly frightening to the entrenched players in the field of retail shopping. It’s easy to suspect some of the major banks must be nervously looking over their shoulder, when new startups appear, their size able to make the transition from “good idea” to “lets try it”, faster than traditional bank customers can type their code into an ATM.
We’ve run the numbers against Mode, the immediate share price prospects looking fairly useful. From our perspective, we can allocate 56.5p as a potential trigger level. In the event this level is exceeded, gains toward an initial 62p look possible with our longer term secondary (or later that day, if good news is involved) calculating at a very possible 70p. Visually, the share needs trade above 83.5p to enter ‘illogical’ territory where we can no longer work out upward numbers. In reality, we suspect we shall need revisit the company, should the 70p level be exceeded.
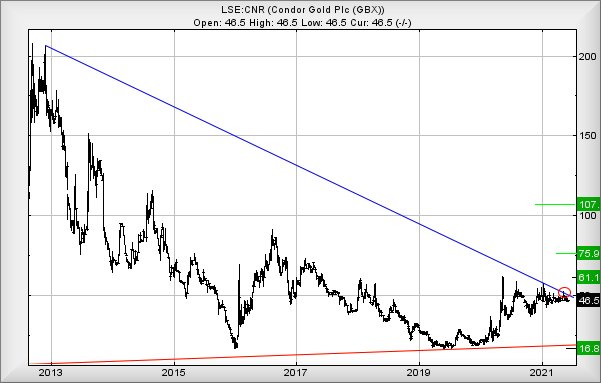
Condor Gold We’ve received a few emails asking us to look at Condor. Their share price is presently trading around 46.5p and appears to be adhering pretty firmly to the Blue downtrend on the chart, regardless of what’s actually happening to the price of Gold. Invariably, this behaviour tends result in a situation where movement, if triggered, tends be faster that the panic rush to change channel, if anything to do with the Scottish football team comes on TV. This, perhaps unfairly, isn’t just our own household. An acquaintance used to boast he’d never attended a Scotland football match, despite travelling the world with the team in his official capacity with the Football Association. It was certainly worth checking with him, when travelling abroad, as he could recommend fabulous restaurants everywhere!
It begs the question, does his behaviour contribute to the often dire performance of the national team?
On the chart below, we’ve painted a little circle around a share price movement recently. This surge to 52.5p, quickly reversed below the trend, gives what should be a reliable starting point as movement above this level works out with an initial ambition of 61p. If exceeded, our secondary calculates at 75p and visually, both target levels make quite a lot of sense.
Perhaps Condor shall prove worth watching. We’d panic, if it managed below 35p.
FUTURES
| Time Issued | Market | Price At Issue | Short Entry | Fast Exit | Slow Exit | Stop | Long Entry | Fast Exit | Slow Exit | Stop | Prior |
| 10:09:13PM | BRENT | 72.84 | ‘cess | ||||||||
| 10:10:55PM | GOLD | 1866.44 | 1862 | 1859.25 | 1833 | 1877 | 1869 | 1877 | 1888 | 1859 | Success |
| 10:13:13PM | FTSE | 7160.2 | ‘cess | ||||||||
| 10:14:58PM | FRANCE | 6627 | ‘cess | ||||||||
| 10:17:27PM | GERMANY | 15720 | Success | ||||||||
| 10:19:24PM | US500 | 4255 | |||||||||
| 10:22:07PM | DOW | 34382 | 34204 | 34174.5 | 33952 | 34403 | 34456 | 34504.5 | 34604 | 34305 | ‘cess |
| 10:33:07PM | NASDAQ | 14119 | |||||||||
| 10:40:23PM | JAPAN | 29252 | Success |
14/06/2021 FTSE Closed at 7146 points. Change of 0.17%. Total value traded through LSE was: £ 5,789,732,909 a change of 12.95%
11/06/2021 FTSE Closed at 7134 points. Change of 0.65%. Total value traded through LSE was: £ 5,126,105,822 a change of 3.18%
10/06/2021 FTSE Closed at 7088 points. Change of 0.1%. Total value traded through LSE was: £ 4,968,352,767 a change of 1.13%
9/06/2021 FTSE Closed at 7081 points. Change of -0.2%. Total value traded through LSE was: £ 4,913,059,029 a change of 3.4%
8/06/2021 FTSE Closed at 7095 points. Change of 0.25%. Total value traded through LSE was: £ 4,751,728,118 a change of 8.88%
7/06/2021 FTSE Closed at 7077 points. Change of 0.11%. Total value traded through LSE was: £ 4,364,121,178 a change of 7.1%
4/06/2021 FTSE Closed at 7069 points. Change of 0.07%. Total value traded through LSE was: £ 4,074,732,159 a change of -14.11%
SUCCESS above means both FAST & SLOW targets were met. ‘CESS means just the FAST target met and probably the next time it is exceeded, movement to the SLOW target shall commence.
Our commentary is in two sections. Immediately below are today’s updated comments. If our commentary remains valid, the share can be found in the bottom section which has a RED heading. Hopefully, this will mean you no longer need to flip back through previous reports. HYPERLINKS DISABLED IN THIS VERSION
Please remember, all prices are mid-price (halfway between the Buy and Sell). When we refer to a price CLOSING above a specific level, we are viewing the point where we can regard a trend as changing. Otherwise, we are simply speculating on near term trading targets. Our website is www.trendsandtargets.com.
UPDATE. We often give an initial and a secondary price. If the initial is exceeded, we still expect it to fall back but the next time the initial is bettered, the price should continue to the secondary. The converse it true with price drops.
We can be contacted at info@trendsandtargets.com. Spam filters set to maximum so only legit emails get through…
Section One – Outlook Updated Today. Click here for Section Two – Outlook Remains Valid shares
Click Epic to jump to share: LSE:BP. BP PLC** **LSE:EMG MAN** **LSE:FOXT Foxtons** **LSE:GKP Gulf Keystone** **LSE:ITV ITV** **LSE:POG Petrop etc** **LSE:SPX Spirax** **LSE:TLW Tullow** **
********
Updated charts published on : BP PLC, MAN, Foxtons, Gulf Keystone, ITV, Petrop etc, Spirax, Tullow,
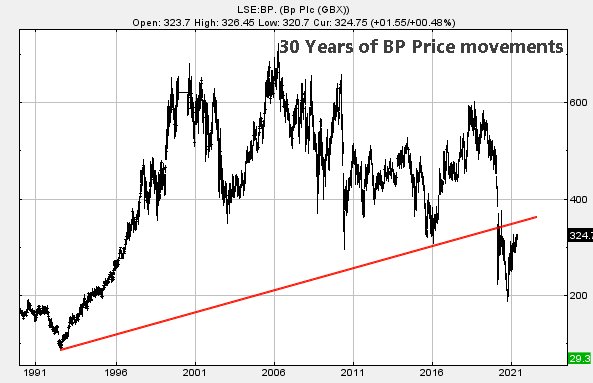
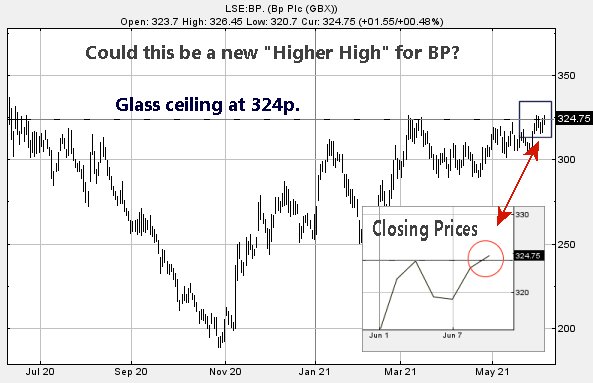
LSE:BP. BP PLC. Close Mid-Price: 330.4 Percentage Change: + 1.88% Day High: 334.3 Day Low: 324.9
Further movement against BP PLC ABOVE 334.3 should improve acceleration t ……..
</p
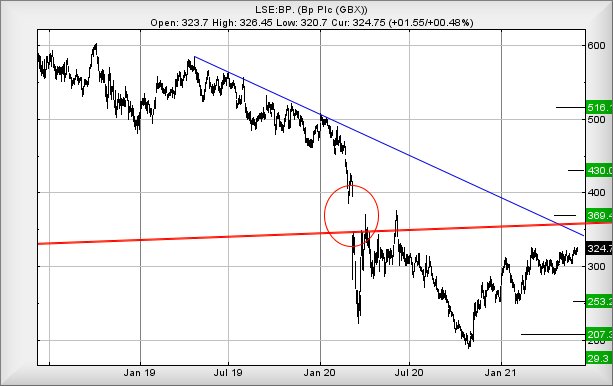
View Previous BP PLC & Big Picture ***
LSE:EMG MAN. Close Mid-Price: 187.35 Percentage Change: + 1.35% Day High: 188.4 Day Low: 185.95
Target met. Continued trades against EMG with a mid-price ABOVE 188.4 sho ……..
</p
View Previous MAN & Big Picture ***
LSE:FOXT Foxtons. Close Mid-Price: 56 Percentage Change: + 0.00% Day High: 57.2 Day Low: 55.6
Continued weakness against FOXT taking the price below 55.6 calculates as ……..
</p
View Previous Foxtons & Big Picture ***
LSE:GKP Gulf Keystone. Close Mid-Price: 196.4 Percentage Change: + 3.70% Day High: 199.2 Day Low: 191.2
This is looking slightly positive! Continuing above 200p looks pretty comf ……..
</p
View Previous Gulf Keystone & Big Picture ***
LSE:ITV ITV. Close Mid-Price: 131.25 Percentage Change: + 0.96% Day High: 134.15 Day Low: 130.3
Further movement against ITV ABOVE 134.15 should improve acceleration tow ……..
</p
View Previous ITV & Big Picture ***
LSE:POG Petrop etc. Close Mid-Price: 26.24 Percentage Change: + 3.39% Day High: 26.38 Day Low: 25.02
It is still the case of weakness below 23 suggesting further relaxation to ……..
</p
View Previous Petrop etc & Big Picture ***
LSE:SPX Spirax Close Mid-Price: 13195 Percentage Change: -0.04% Day High: 13325 Day Low: 13140
In the event of Spirax enjoying further trades beyond 13325, the share sh ……..
</p
View Previous Spirax & Big Picture ***
LSE:TLW Tullow. Close Mid-Price: 64.84 Percentage Change: + 8.65% Day High: 65.78 Day Low: 59.92
Target met. Further movement against Tullow ABOVE 65.78 should improve ac ……..
</p
View Previous Tullow & Big Picture ***