#FTSE #WallSt Something quite amazing is happening in the world of hair curler machinery. My wife’s addiction to the Chinese website, Temu, led her to discover a machine which would curl strands of hair. Without any consideration, she plugged the thing onto a USB charging cable, already knowing this exquisite probable*** torture device was rechargeable and similar to every other convenient piece of junk being sourced from China. We now own rechargeable salt & pepper grinders, a small stirrer, a tiny little vacuum, soap dispensers, even something to do with fingernails. It seems the concept of ‘rechargeable’ has already expanded massively, affecting rather more than vehicles, mobile phones, and earbuds.
***For some reason, any device which involves long hair and electric motors inevitably will go wrong, requiring dismantling a tool or an extended discussion involving sharp scissors.
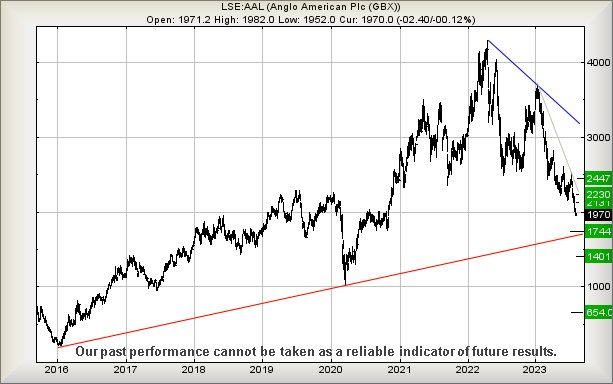
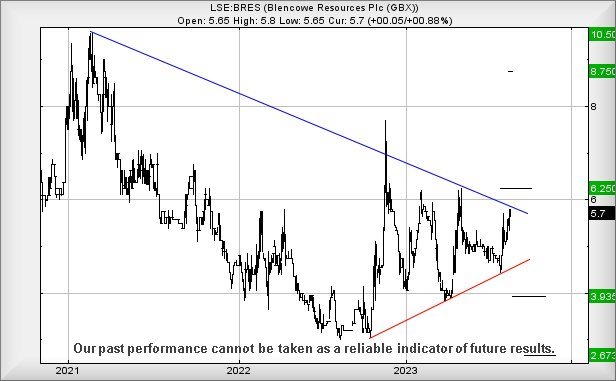
It’s funny, growing up assuming Graphite was the stuff within pencils and gradually noticing it had made its way into lubricants and Formula 1 cars. However, it’s becoming more popular again, due to its use within lithium ion batteries, hence the potential success for miners involved in the Graphite industry. For more information, it’s worth a glance at the Blencowe website or more probably, take a look at all the rechargeable items now cluttering up your kitchen drawers!
Blencowe Resources Plc have a share price which appears to be taking an interest in life. The immediate potential we’re keeping an eye on is the hope movement above 5.7p shall produce share price recovery to an initial (fairly useless) 6.25p. We’re therefore inclined to regard 6.25 as a trigger level, due to movement above such a point calculating with the potential of a price lift to 8.75p. Visually, there’s a suggestion any visit to 8.75 should experience some hesitation, if only due to the share prices previous highs in 2021. Our longer term secondary, should such an ambition be exceeded, calculates at 10.5p, a price above which we shall need look hard at the tea leaves again as we currently run out of numbers. While common sense reminds us to anticipate hesitation at such a level, it shall be worth watching for the market discovering excuses to gap the share up at the open of trade in the months ahead. Such behaviour will tend suggest our 10.5p could be utterly ignored.
Should the battery decide to go flat on Blencowe, below Red at 4.5 current risks raising an eyebrow, allowing reversal to 3.9p initially with secondary, if broken, at 2.67 and a share price level below which we cannot calculate.
FUTURES
| Time Issued | Market | Price At Issue | Short Entry | Fast Exit | Slow Exit | Stop | Long Entry | Fast Exit | Slow Exit | Stop | Prior |
| 10:40:55PM | BRENT | 8334 | ‘cess | ||||||||
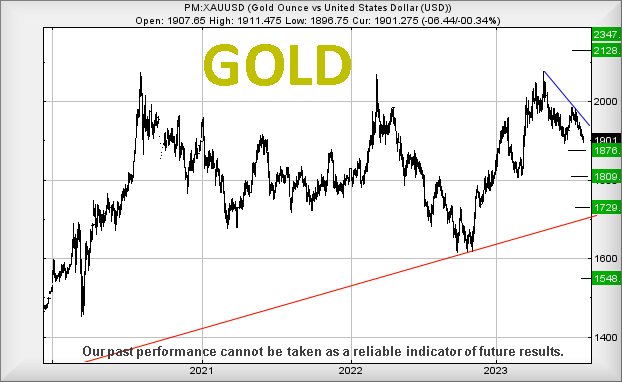
| 10:43:40PM | GOLD | 1897.88 | ‘cess | ||||||||
| 10:45:43PM | FTSE | 7266.49 | 7253 | 7238 | 7213 | 7279 | 7318 | 7341 | 7371 | 7271 | |
| 10:48:27PM | STOX50 | 4250.4 | |||||||||
| 10:51:03PM | GERMANY | 15689.7 | ‘cess | ||||||||
| 10:53:11PM | US500 | 4388.1 | Success | ||||||||
| 10:56:59PM | DOW | 34298 | 34254 | 34115 | 33956 | 34390 | 34643 | 34772 | 34946 | 34405 | |
| 10:58:50PM | NASDAQ | 14909.3 | |||||||||
| 11:01:42PM | JAPAN | 31762 | Shambles |
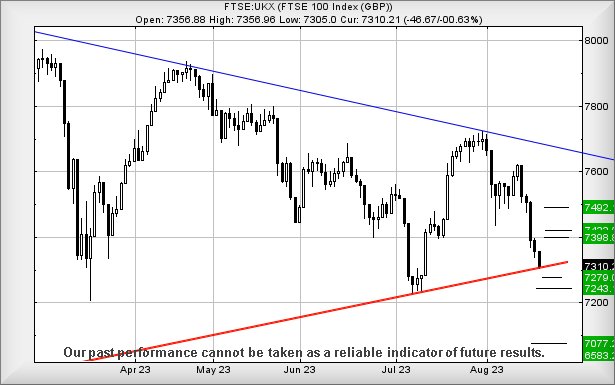
22/08/2023 FTSE Closed at 7270 points. Change of 0.18%. Total value traded through LSE was: £ 3,933,596,955 a change of 1.59%
21/08/2023 FTSE Closed at 7257 points. Change of -0.07%. Total value traded through LSE was: £ 3,872,219,406 a change of -12.04%
18/08/2023 FTSE Closed at 7262 points. Change of -0.66%. Total value traded through LSE was: £ 4,402,136,865 a change of 33.13%
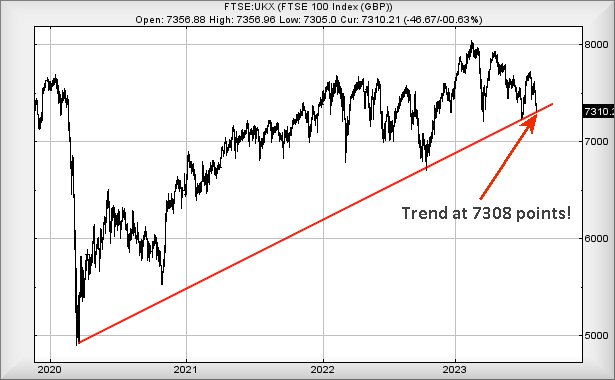
17/08/2023 FTSE Closed at 7310 points. Change of -0.63%. Total value traded through LSE was: £ 3,306,539,758 a change of -30.86%
16/08/2023 FTSE Closed at 7356 points. Change of -0.45%. Total value traded through LSE was: £ 4,782,194,827 a change of 34.91%
15/08/2023 FTSE Closed at 7389 points. Change of -1.57%. Total value traded through LSE was: £ 3,544,639,764 a change of -13.22%
14/08/2023 FTSE Closed at 7507 points. Change of -0.23%. Total value traded through LSE was: £ 4,084,432,990 a change of -33.31%
SUCCESS above means both FAST & SLOW targets were met. ‘CESS means just the FAST target met and probably the next time it is exceeded, movement to the SLOW target shall commence.
Our commentary is in two sections. Immediately below are today’s updated comments. If our commentary remains valid, the share can be found in the bottom section which has a RED heading. Hopefully, this will mean you no longer need to flip back through previous reports. HYPERLINKS DISABLED IN THIS VERSION
Please remember, all prices are mid-price (halfway between the Buy and Sell). When we refer to a price CLOSING above a specific level, we are viewing the point where we can regard a trend as changing. Otherwise, we are simply speculating on near term trading targets. Our website is www.trendsandtargets.com.
UPDATE. We often give an initial and a secondary price. If the initial is exceeded, we still expect it to fall back but the next time the initial is bettered, the price should continue to the secondary. The converse it true with price drops.
We can be contacted at info@trendsandtargets.com. Spam filters set to maximum so only legit emails get through…
Section One – Outlook Updated Today. Click here for Section Two – Outlook Remains Valid shares
Click Epic to jump to share: LSE:CNA Centrica** **LSE:CPI Capita** **LSE:EMG MAN** **LSE:IQE IQE** **LSE:JET Just Eat** **LSE:NG. National Glib** **LSE:NWG Natwest** **LSE:OXIG Oxford Instruments** **LSE:RKH Rockhopper** **LSE:RR. Rolls Royce** **LSE:SPX Spirax** **LSE:TERN Tern Plc** **LSE:TRN The Trainline** **
********
Updated charts published on : Centrica, Capita, MAN, IQE, Just Eat, National Glib, Natwest, Oxford Instruments, Rockhopper, Rolls Royce, Spirax, Tern Plc, The Trainline,
LSE:CNA Centrica. Close Mid-Price: 146.45 Percentage Change: + 1.60% Day High: 146.9 Day Low: 144.65
Continued trades against CNA with a mid-price ABOVE 147 should improve the ……..
</p
View Previous Centrica & Big Picture ***
LSE:CPI Capita Close Mid-Price: 18.38 Percentage Change: -2.34% Day High: 19.1 Day Low: 18.28
Ongoing travel against CPI taking the price below 18 calculates as leading ……..
</p
View Previous Capita & Big Picture ***
LSE:EMG MAN. Close Mid-Price: 203.1 Percentage Change: + 0.54% Day High: 204.4 Day Low: 200.5
Weakness on MAN below 200 will invariably lead to 193 with secondary (if b ……..
</p
View Previous MAN & Big Picture ***
LSE:IQE IQE Close Mid-Price: 17.54 Percentage Change: -2.34% Day High: 18 Day Low: 17.54
If IQE experiences continued weakness below 17.5, it will invariably lead ……..
</p
View Previous IQE & Big Picture ***
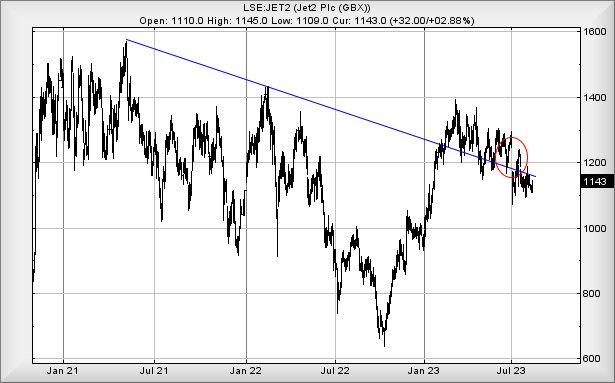
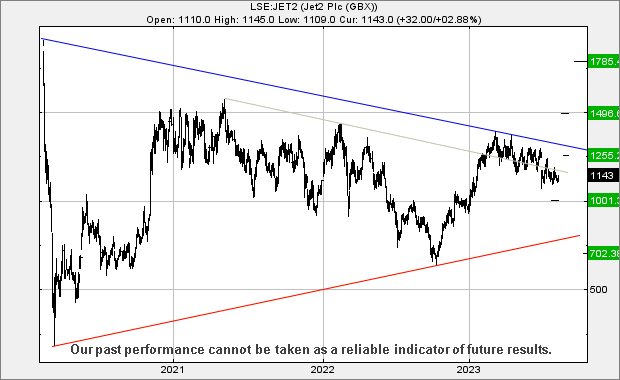
LSE:JET Just Eat Close Mid-Price: 1069 Percentage Change: -2.73% Day High: 1106 Day Low: 1057
This is getting seriously dodgy as weakness now on Just Eat below 1044 wil ……..
</p
View Previous Just Eat & Big Picture ***
LSE:NG. National Glib Close Mid-Price: 942.8 Percentage Change: -0.34% Day High: 950.4 Day Low: 939.6
Continued weakness against NG. taking the price below 939 calculates as le ……..
</p
View Previous National Glib & Big Picture ***
LSE:NWG Natwest Close Mid-Price: 221.9 Percentage Change: -0.89% Day High: 225.6 Day Low: 221.8
In the event Natwest experiences weakness below 221 it calculates with a d ……..
</p
View Previous Natwest & Big Picture ***
LSE:OXIG Oxford Instruments. Close Mid-Price: 2160 Percentage Change: + 2.13% Day High: 2185 Day Low: 2120
If Oxford Instruments experiences continued weakness below 2120, it will i ……..
</p
View Previous Oxford Instruments & Big Picture ***
LSE:RKH Rockhopper Close Mid-Price: 11.88 Percentage Change: -2.46% Day High: 12.1 Day Low: 11.5
In the event Rockhopper experiences weakness below 11.5, it calculates wit ……..
</p
View Previous Rockhopper & Big Picture ***
LSE:RR. Rolls Royce Close Mid-Price: 201.1 Percentage Change: -0.40% Day High: 205.1 Day Low: 200.3
Continued trades against RR. with a mid-price ABOVE 211.2 should improve t ……..
</p
View Previous Rolls Royce & Big Picture ***
LSE:SPX Spirax Close Mid-Price: 9734 Percentage Change: -0.79% Day High: 9852 Day Low: 9700
In the event Spirax experiences weakness below 9700, it calculates with a ……..
</p
View Previous Spirax & Big Picture ***
LSE:TERN Tern Plc Close Mid-Price: 4.38 Percentage Change: -7.89% Day High: 5 Day Low: 4.38
In the event Tern Plc experiences weakness below 4.3, it calculates with a ……..
</p
View Previous Tern Plc & Big Picture ***
LSE:TRN The Trainline Close Mid-Price: 216.4 Percentage Change: -5.58% Day High: 231.6 Day Low: 217.2
Target Met. Weakness on The Trainline now below 211 will invariably lead t ……..
</p
View Previous The Trainline & Big Picture ***