Lloyds Bank (LSE:LLOY) Of all the trite sayings attributed to the stock market, “The Trend’s Your Friend” is probably the most annoying. Just what is a sodding trend? Is it a line on a chart, if so, what line. Or is it something to do with the share price, in relation to whatever it used to be. Perhaps it’s something to do with the media and their unfortunate habit of assigning “Strong Buy” or “Strong Sell” against a share price!
It’s all important, it’s all nonsense, and it’s all hitting us every day.
Currently, Lloyds Bank presents a perfect ‘case in point’.
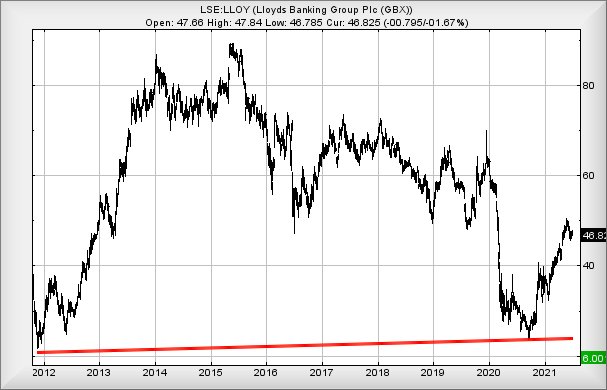
The big chart from 2012 (below) suggests utter panic, should Lloyds find sufficient excuse to slither below the 24p level, represented by a big Red line. From our perspective, this makes some sense as it produces a picture where Lloyds risks bottoming at 6p or so. In an easy summary, the share price needs half before panic ensues but, to be fair, the way the market works it wouldn’t exactly surprise us if the share dipped below 24p in an opening second movement, triggering a load of stop loss levels and then, produced a miracle bounce anyway. Always remember, the market is in business to make money.
Then, there’s another trend line, one since the lows of 2020. Presently, this adornment lurks at roughly 42p with the bank share price safely above.
Perhaps we should talk about the 2021 trend, starting from a low of 33p. Currently this ad hoc line lurks at 46p, dangerously close to the current price level of 47p!
“Which sodding trend should be watched?”
From our perspective, focused on numbers, the answer is pretty simple. None of them…
The bank share price needs slink below 44p to force raised eyebrows, this suggesting some weakness has entered calculations with the share trading at lower levels, since the market opted to “gap” the price up in April. Initially we’d be looking for a phoney bounce at 42p before the share found a bottom level at around 39.5p. Absent from this tier of calculations is any form of trend line. Prices go up and down with movement since the pandemic hit tending suggest painting a line on a chart will provide little clue. Instead, it’s worth reviewing historical movements in relation to these calculated target levels, just to see if they make any sort of visual sense. In the case of 39.5p as a potential bounce point, price shuffles in 2021 and again, at the end of 2020, tend suggest it worth paying attention to, if it even appears. Please remember, we are describing a movement scenario, attempting to wrap it up in writing what makes sense! At the very minimum, there is a gap (circled) at 42p, one which the gullible will be inclined to believe another trite market saying;
“Gaps are always covered”
They are not. And if they are, the movement is rarely exact.
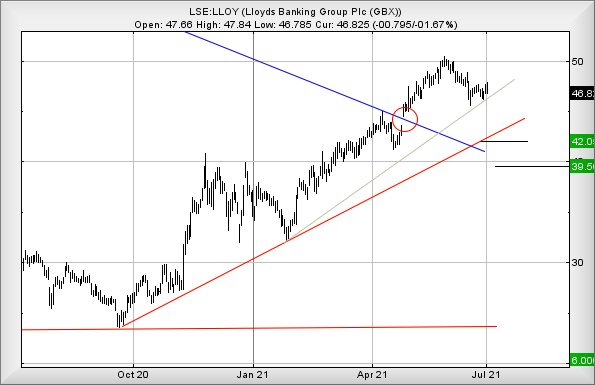
We write about Lloyds share price every three weeks, generally expressing considerable frustration at the lack of movement. For the present, we’re supposed to be interested in a trading range of just of 2p since last time we put pen to paper. This isn’t an encouraging state of affairs but to return again to the circled area on the chart at 42p at the end of April, there’s little doubt the market opted to manipulate the share price higher, above the immediate Blue downtrend. In a normal world, this should provide a pretty solid indication of coming growth, a substantial clue being the market opting to remove the share price from a downtrend.
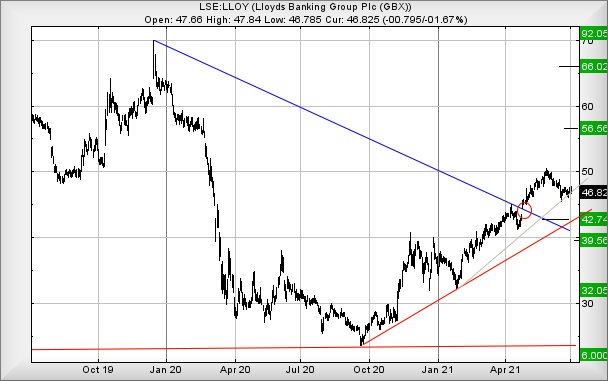
At this stage, we’d ordinarily be persuading folk to look for “higher highs” but thanks to the gap, the price is already substantially above all the highs before the trend break. As a result, we’re inclined to invent a price level the share absolutely must exceed, if the price intends to break free of its lethargic 18 months. In the case of Lloyds, only above 51.5p shall convince us some solid movement is upon us, calculating with an initial ambition of 56.5p. If exceeded, our longer term secondary comes along at 66p and visually matches the share price highs, pre-Covid. Once this milestone is attained, it shall be worth paying close attention to the point at which the share price actually closes a session. In the event of closure above just 67p, the value enters the land of “Higher Highs” again, providing an astounding 92p as a viable longer term hope.
Many thanks to all the folk who find the adverts Google places on this webpage worthy of a visit. We enjoy the coffee the income buys, along with the odd croissant!
FUTURES
| Time Issued | Market | Price At Issue | Short Entry | Fast Exit | Slow Exit | Stop | Long Entry | Fast Exit | Slow Exit | Stop | Prior |
| 1:58:53PM | BRENT | 76.02 | 75.15 | 74.565 | 73.86 | 76.08 | 76.35 | 76.455 | 76.89 | 75.65 | |
| 2:01:27PM | GOLD | 1787.88 | ‘cess | ||||||||
| 2:27:20PM | FTSE | 7128.6 | Shambles | ||||||||
| 2:34:50PM | FRANCE | 6554.3 | |||||||||
| 2:41:14PM | GERMANY | 15649 | 15597 | 15565.5 | 15518 | 15688 | 15708 | 15731 | 15814 | 15611 | |
| 2:57:08PM | US500 | 4352.57 | Success | ||||||||
| 2:59:38PM | DOW | 34798.4 | Success | ||||||||
| 3:04:48PM | NASDAQ | 14723.85 | Success | ||||||||
| 3:09:50PM | JAPAN | 28729 |
2/07/2021 FTSE Closed at 7123 points. Change of -0.03%. Total value traded through LSE was: £ 4,184,057,082 a change of -10.65%
1/07/2021 FTSE Closed at 7125 points. Change of 1.25%. Total value traded through LSE was: £ 4,682,685,719 a change of -14.48%
30/06/2021 FTSE Closed at 7037 points. Change of -0.71%. Total value traded through LSE was: £ 5,475,559,287 a change of 23.7%
29/06/2021 FTSE Closed at 7087 points. Change of 0.21%. Total value traded through LSE was: £ 4,426,489,456 a change of -5.63%
28/06/2021 FTSE Closed at 7072 points. Change of -0.9%. Total value traded through LSE was: £ 4,690,740,791 a change of -4.03%
25/06/2021 FTSE Closed at 7136 points. Change of 0.38%. Total value traded through LSE was: £ 4,887,856,351 a change of -13.99%
24/06/2021 FTSE Closed at 7109 points. Change of 0.49%. Total value traded through LSE was: £ 5,682,704,264 a change of 17.41%
SUCCESS above means both FAST & SLOW targets were met. ‘CESS means just the FAST target met and probably the next time it is exceeded, movement to the SLOW target shall commence.
Our commentary is in two sections. Immediately below are today’s updated comments. If our commentary remains valid, the share can be found in the bottom section which has a RED heading. Hopefully, this will mean you no longer need to flip back through previous reports. HYPERLINKS DISABLED IN THIS VERSION
Please remember, all prices are mid-price (halfway between the Buy and Sell). When we refer to a price CLOSING above a specific level, we are viewing the point where we can regard a trend as changing. Otherwise, we are simply speculating on near term trading targets. Our website is www.trendsandtargets.com.
UPDATE. We often give an initial and a secondary price. If the initial is exceeded, we still expect it to fall back but the next time the initial is bettered, the price should continue to the secondary. The converse it true with price drops.
We can be contacted at info@trendsandtargets.com. Spam filters set to maximum so only legit emails get through…
Section One – Outlook Updated Today. Click here for Section Two – Outlook Remains Valid shares
Click Epic to jump to share: LSE:AV. Aviva** **LSE:BLOE Block Energy PLC** **LSE:DDDD 4D Pharma** **LSE:ECO ECO (Atlantic) O & G** **LSE:FGP Firstgroup** **LSE:HIK Hikma** **LSE:PMG Parkmead** **LSE:QFI Quadrise** **LSE:VEC Vectura** **
********
Updated charts published on : Aviva, Block Energy PLC, 4D Pharma, ECO (Atlantic) O & G, Firstgroup, Hikma, Parkmead, Quadrise, Vectura,
LSE:AV. Aviva. Close Mid-Price: 407.6 Percentage Change: + 0.07% Day High: 412.8 Day Low: 406.9
Below 403 looks slightly problematic, allowing reversal to 392 with second ……..
</p
View Previous Aviva & Big Picture ***
LSE:BLOE Block Energy PLC Close Mid-Price: 2.65 Percentage Change: -3.64% Day High: 2.8 Day Low: 2.7
Below 2.6 looks like triggering reversal to an initial 2.2 and hopefully a ……..
</p
View Previous Block Energy PLC & Big Picture ***
LSE:DDDD 4D Pharma. Close Mid-Price: 96.9 Percentage Change: + 0.00% Day High: 100 Day Low: 95.8
Below 89 suggests issues, permitting reversal to an initial 82 with second ……..
</p
View Previous 4D Pharma & Big Picture ***
LSE:ECO ECO (Atlantic) O & G. Close Mid-Price: 28.75 Percentage Change: + 4.55% Day High: 30 Day Low: 27.5
All ECO (Atlantic) O & G needs are mid-price trades ABOVE 30 to improve a ……..
</p
View Previous ECO (Atlantic) O & G & Big Picture ***
LSE:FGP Firstgroup Close Mid-Price: 85.4 Percentage Change: -2.29% Day High: 90.15 Day Low: 84.9
Continued trades against FGP with a mid-price ABOVE 90.15 should improve ……..
</p
View Previous Firstgroup & Big Picture ***
LSE:HIK Hikma. Close Mid-Price: 2543 Percentage Change: + 0.12% Day High: 2598 Day Low: 2537
Continued trades against HIK with a mid-price ABOVE 2598 should improve t ……..
</p
View Previous Hikma & Big Picture ***
LSE:PMG Parkmead. Close Mid-Price: 51 Percentage Change: + 12.09% Day High: 50 Day Low: 46
Target met. Further movement against Parkmead ABOVE 50 should improve acc ……..
</p
View Previous Parkmead & Big Picture ***
LSE:QFI Quadrise Close Mid-Price: 3.37 Percentage Change: -3.86% Day High: 3.82 Day Low: 3.33
In the event Quadrise experiences weakness below 3.33 it calculates with ……..
</p
View Previous Quadrise & Big Picture ***
LSE:VEC Vectura. Close Mid-Price: 136.8 Percentage Change: + 0.29% Day High: 137.4 Day Low: 132.6
If Vectura experiences continued weakness below 132.6, it will invariably ……..
</p
View Previous Vectura & Big Picture ***