#FreeFutures #FTSE Digging through her great-grandmothers old sewing box, my wife unearthed a spool of lead, the heavy metal roughly the same thickness as a metal clothes hanger. She explained, patiently, the long deceased relative probably planned to use the lead to add weight to a garments hem. And asked, “could I use the spool for anything?”
The answer, obviously, was YES and the little treasure was immediately spirited away and stored in the odds&ends drawer in the shed, vanishing among the collection of spare screws, fittings, and miscellaneous leftovers from self assembly furniture. Over dinner, my wife asked just what I intended use the lead for?
“No idea, but it could be really handy.”
“You know that sowing box was around 70 years old, the lead stored in a belief it would be ‘really handy’ one day?”
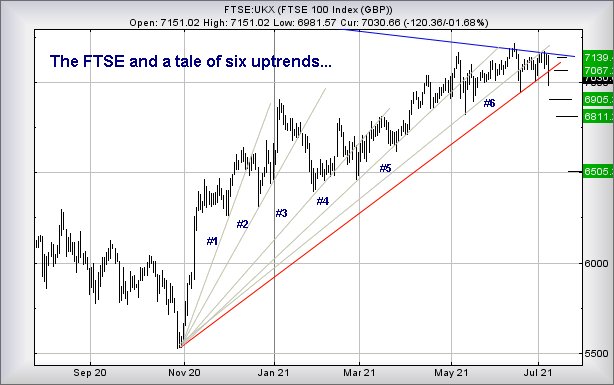
This moment of pause for thought actually relates to the FTSE. For quite a few weeks, I’ve been patiently adhering to the idea the UK market shall recover. This belief, stored in a little area of my brain probably shaped like a shed, has tended drive my opinions, despite the market failing to actually do anything particularly useful. But similar to this spool of lead, the belief in recovery has been protected despite the FTSE failing to do anything useful since April.
From a chart perspective, it’s fairly easy to lose faith, were it not for a series of ghostly trend lines on the FTSE chart. Since October last year, five trend lines established themselves and despite the FTSE breaking each uptrend, the market has recovered and in doing so, maintained the FTSE’s place as one of the slowest moving markets in the G7! We’re now at the stage where Red Trend Line #6 has broken (Important: Our criteria for a trend break demands a price close a session below the trend) and, if only due to frustration, our upbeat tone on the FTSE should perhaps end as we embrace a complete lack of optimism. Maybe we’re confusing optimism with utter boredom, due to flat market conditions?
Watching the CEO of a banking concern on TV, the interviewer was attempting to get the guy to admit Thursdays behaviour on USA markets was obviously the beginning of the end for the current stock market bubble. The response was clearly not the one desired, when instead the interviewee simply said; “markets go up and down. At present, the markets are producing all time highs and a blip on a bad day is just that, a blip.”
Hopefully he’s proven correct, the DOW needing exceed 35,000 points to completely assure us Thursday was just a blip.
To return to the FTSE, it closed Thursday at 7030 points. The UK index needs below 6980 to provoke some near term concerns, risking reversal toward an initial 6905 points with secondary, if broken, calculating at 6811 points. The secondary target level is a major nuisance, thanks to closure around this level placing the market at severe risk of a dive down to the 6500 level. In such an instance, the spool of lead could be repurposed into making a balloon…
Our alternate, optimists scenario, actually feels more likely. Should the FTSE manage to clamber above just 7038 points, we calculate the potential of a climb to 7067 points. If bettered, our secondary works out at 7139 points and returns the FTSE to a point where it risks challenging the Blue downtrend. Embedded amongst these boring numbers is a little detail worthy of mention. Should the FTSE reach 7067 points, the market exceeds the point of Thursdays trend break, suggesting the trend was wrong and conceding the little Red line should join its 5 previous incarnations in being coloured a forgetful grey.
FUTURES
| Time Issued | Market | Price At Issue | Short Entry | Fast Exit | Slow Exit | Stop | Long Entry | Fast Exit | Slow Exit | Stop | Prior |
| 10:42:29PM | BRENT | 74.15 | 72.7 | 72.085 | subscribe | 73.5 | 74.18 | 74.315 | subscribe | 72.4 | ‘cess |
| 10:44:30PM | GOLD | 1803.14 | 1793 | 1785 | 1804 | 1806 | 1810 | 1793 | Success | ||
| 10:47:18PM | FTSE | 7036.38 | 7012 | 6988.5 | 7058 | 7059 | 7087 | 7008 | Success | ||
| 10:51:25PM | FRANCE | 6399.9 | 6345 | 6306 | 6415 | 6432 | 6451.5 | 6385 | Success | ||
| 10:53:56PM | GERMANY | 15405.65 | 15376 | 15314.5 | 15518 | 15528 | 15545.5 | 15380 | Success | ||
| 10:56:23PM | US500 | 4318.47 | 4302 | 4288 | 4335 | 4338 | 4352 | 4304 | Success | ||
| 10:58:35PM | DOW | 34397 | 34104 | 33999 | 34299 | 34604 | 34675.5 | 34424 | Success | ||
| 11:00:45PM | NASDAQ | 14728 | 14550 | 14497.5 | 14677 | 14804 | 14874 | 14730 | Success | ||
| 11:02:59PM | JAPAN | 27726 | 27687 | 27603 | 27856 | 27858 | 27936 | 27693 |

8/07/2021 FTSE Closed at 7030 points. Change of -1.69%. Total value traded through LSE was: £ 5,350,338,695 a change of -5.7%
7/07/2021 FTSE Closed at 7151 points. Change of 0.72%. Total value traded through LSE was: £ 5,673,997,934 a change of 23.9%
6/07/2021 FTSE Closed at 7100 points. Change of -0.89%. Total value traded through LSE was: £ 4,579,399,515 a change of 38.26%
5/07/2021 FTSE Closed at 7164 points. Change of 0.58%. Total value traded through LSE was: £ 3,312,078,677 a change of -20.84%
2/07/2021 FTSE Closed at 7123 points. Change of -0.03%. Total value traded through LSE was: £ 4,184,057,082 a change of -10.65%
1/07/2021 FTSE Closed at 7125 points. Change of 1.25%. Total value traded through LSE was: £ 4,682,685,719 a change of -14.48%
30/06/2021 FTSE Closed at 7037 points. Change of -0.71%. Total value traded through LSE was: £ 5,475,559,287 a change of 23.7%
SUCCESS above means both FAST & SLOW targets were met. ‘CESS means just the FAST target met and probably the next time it is exceeded, movement to the SLOW target shall commence.
Our commentary is in two sections. Immediately below are today’s updated comments. If our commentary remains valid, the share can be found in the bottom section which has a RED heading. Hopefully, this will mean you no longer need to flip back through previous reports. HYPERLINKS DISABLED IN THIS VERSION
Please remember, all prices are mid-price (halfway between the Buy and Sell). When we refer to a price CLOSING above a specific level, we are viewing the point where we can regard a trend as changing. Otherwise, we are simply speculating on near term trading targets. Our website is www.trendsandtargets.com.
UPDATE. We often give an initial and a secondary price. If the initial is exceeded, we still expect it to fall back but the next time the initial is bettered, the price should continue to the secondary. The converse it true with price drops.
We can be contacted at info@trendsandtargets.com. Spam filters set to maximum so only legit emails get through…
Section One – Outlook Updated Today. Click here for Section Two – Outlook Remains Valid shares
Click Epic to jump to share: LSE:AV. Aviva** **LSE:BARC Barclays** **LSE:BDEV Barrett Devs** **LSE:BP. BP PLC** **LSE:EME Empyrean** **LSE:FOXT Foxtons** **LSE:HSBA HSBC** **LSE:IHG Intercontinental Hotels Group** **LSE:LLOY Lloyds Grp.** **LSE:POG Petrop etc** **LSE:RMG Royal Mail** **LSE:STAN Standard Chartered** **LSE:TSCO Tesco** **LSE:VOD Vodafone** **
********
Updated charts published on : Aviva, Barclays, Barrett Devs, BP PLC, Empyrean, Foxtons, HSBC, Intercontinental Hotels Group, Lloyds Grp., Petrop etc, Royal Mail, Standard Chartered, Tesco, Vodafone,
LSE:AV. Aviva Close Mid-Price: 397.8 Percentage Change: -3.35% Day High: 408.9 Day Low: 395.6
If Aviva experiences continued weakness below 395.6, it will invariably l ……..
</p
View Previous Aviva & Big Picture ***
LSE:BARC Barclays Close Mid-Price: 167.64 Percentage Change: -2.82% Day High: 170.88 Day Low: 165.22
Weakness on Barclays below 165.22 will invariably lead to 162 with second ……..
</p
View Previous Barclays & Big Picture ***
LSE:BDEV Barrett Devs Close Mid-Price: 688.8 Percentage Change: -3.64% Day High: 711.2 Day Low: 681.4
Weakness on Barrett Devs below 681.4 will invariably lead to 674 with sec ……..
</p
View Previous Barrett Devs & Big Picture ***
LSE:BP. BP PLC. Close Mid-Price: 307.7 Percentage Change: + 0.00% Day High: 309.35 Day Low: 301.2
If BP PLC experiences continued weakness below 301, it will invariably le ……..
</p
View Previous BP PLC & Big Picture ***
LSE:EME Empyrean. Close Mid-Price: 8.5 Percentage Change: + 3.66% Day High: 8.9 Day Low: 8.15
Target met. Continued trades against EME with a mid-price ABOVE 8.9 shoul ……..
</p
View Previous Empyrean & Big Picture ***
LSE:FOXT Foxtons Close Mid-Price: 57.7 Percentage Change: -2.37% Day High: 58.7 Day Low: 55.8
This is still a bit dodgy, despite failing to drop yet. Below 55 now point ……..
</p
View Previous Foxtons & Big Picture ***
LSE:HSBA HSBC Close Mid-Price: 410.6 Percentage Change: -1.76% Day High: 413.7 Day Low: 406.7
If HSBC experiences continued weakness below 406.7, it will invariably le ……..
</p
View Previous HSBC & Big Picture ***
LSE:IHG Intercontinental Hotels Group Close Mid-Price: 4734 Percentage Change: -2.55% Day High: 4839 Day Low: 4667
Weakness on Intercontinental Hotels Group below 4667 will invariably lead ……..
</p
View Previous Intercontinental Hotels Group & Big Picture ***
LSE:LLOY Lloyds Grp. Close Mid-Price: 45.62 Percentage Change: -2.51% Day High: 46.38 Day Low: 44.95
Target met. In the event Lloyds Grp. experiences weakness below 44.95 it ……..
</p
View Previous Lloyds Grp. & Big Picture ***
LSE:POG Petrop etc Close Mid-Price: 22.92 Percentage Change: -2.30% Day High: 23.54 Day Low: 22.84
If Petrop etc experiences continued weakness below 22.84, it will invaria ……..
</p
View Previous Petrop etc & Big Picture ***
LSE:RMG Royal Mail Close Mid-Price: 568.6 Percentage Change: -0.94% Day High: 571.4 Day Low: 560.4
Weakness on Royal Mail below 560.4 will invariably lead to 544 with secon ……..
</p
View Previous Royal Mail & Big Picture ***
LSE:STAN Standard Chartered Close Mid-Price: 446 Percentage Change: -1.20% Day High: 450.9 Day Low: 442.7
Weakness on Standard Chartered below 442.7 will invariably lead to 415 wi ……..
</p
View Previous Standard Chartered & Big Picture ***
LSE:TSCO Tesco Close Mid-Price: 234.25 Percentage Change: -1.35% Day High: 240.85 Day Low: 233.8
All Tesco needs are mid-price trades ABOVE 240.85 to improve acceleration ……..
</p
View Previous Tesco & Big Picture ***
LSE:VOD Vodafone Close Mid-Price: 117.86 Percentage Change: -1.02% Day High: 119.1 Day Low: 116.66
In the event Vodafone experiences weakness below 116.66 it calculates wit ……..
</p
View Previous Vodafone & Big Picture ***