Thomas Cook for 7/08/2019

#CAC40 #SP500 Sometimes, passengers in an aircraft experience an awful moment on the ground, waiting to disembark. An announcement says there will be a delay “of just a few minutes” and seasoned travellers know what that really means. Today, Tuesday, passengers in TCG’s share price disaster (prior successful report link) must have felt a similar emotion, the price looking like it was about to recover, then a “gotcha suckers” drop!

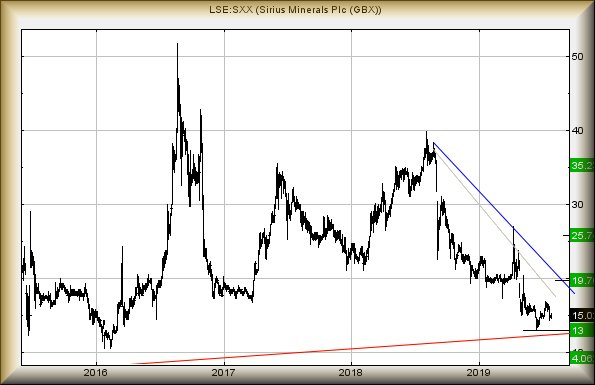
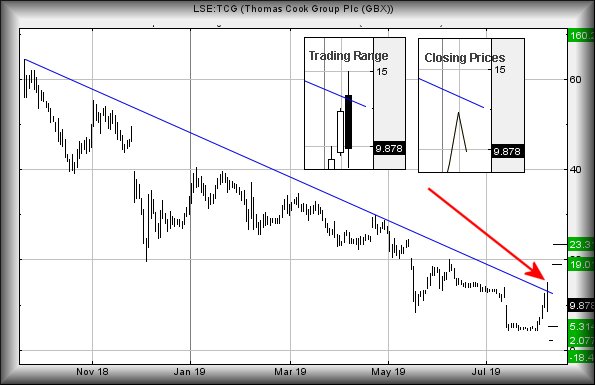
Over the years, we’ve warned repeatedly about the dangers of opening second spikes in a share. These price movements can run in either direction but our rule of thumb is of a spike down signalling a coming upward movement. Obviously, the converse is true for a spike up. TCG was spiked to 15p, curiously NOT in the opening second but rather, twelve minutes after the market opened. While perhaps this indicates a change in market strategy (as we’ve seen this a few times in the last month) but regardless, the effect was pretty dire and allows Thomas Cook to experience a trading range of 65.08%  for Tuesday. It was virtually impossible to allocate a sensible stop loss, regardless of which direction you thought it was going and perhaps this was the markets idea.

We’ve a bit of in-house mumbo jumbo now warning of danger, if Thomas Cook somehow makes it below 7.65p. Apparently, this will be a bad thing and calculates with the potential of travel down to an initial 5.3p. If broken, secondary is at 2p and hopefully bottom. Ultimate bottom is MINUS 18p (not possible).

However, for now I suspect holders of TCG are simply stuck on board, awaiting something positive happening. Price movements on the 6th August did suggest a holding pattern was being employed. If this is indeed the case, anything now exceeding 13.6p is liable to prove useful, bettering the BLUE downtrend and calculating with the potential of 19p next. If bettered, our secondary is at 23.3p and an almost certain hesitation in the recovery cycle.

FUTURES

Time Issued

Market

Price At Issue

Short Entry

Fast Exit

Slow Exit

Stop

Long Entry

Fast Exit

Slow Exit

Stop

Prior

9:57:00PM

BRENT

58.49


‘cess

10:10:16PM

GOLD

1475.06


10:12:41PM

FTSE

7206.66


10:14:53PM

FRANCE

5267.7

5228

5208.5

5179

5287

5298

5319.5

5364

5243

Success

10:28:35PM

GERMANY

11629


10:31:09PM

US500

2877.27

2830

2808

2782

2861

2889

2901

2925

2830

‘cess

10:33:35PM

DOW

25966


Success

10:35:44PM

NASDAQ

7514.12


‘cess

10:37:35PM

JAPAN

20635


Success


6/08/2019 FTSE Closed at 7171 points. Change of -0.72%. Total value traded through LSE was: £ 6,677,276,467 a change of 2.51%

GBPEUR for 6/08/2019

#Gold #Nasdaq Forex can be a blooming nuisance. When GBPEUR managed to hit our 1.085, normally we’d hope for a rebound of some substance. Unfortunately, the relationship faltered slightly below target, forcing us to actually work at projecting the next phase. Assuming the politicians involved achieve their usual standard of competence, the future looks pretty vile. But really cheap for tourists coming from Europe!

We’re no longer entirely confident this pairing shall bounce convincingly, thanks to our target level breaking. Instead, weakness now below 1.083 looks like entering a fresh cycle down to an initial 1.0700. If broken, secondary calculates at 1.0337. Allegedly, the relation almost must experience some recovery at such a level, if only to generate sufficient weight for longer term drops! Make no mistake, by any standards GBPEUR is officially horrible as the longer term calculation claims a gravitational attraction is being exerted from a distant looking 0.84.

To get out of this mess, Sterling needs recover above BLUE on the chart, presently at 1.145. A miracle such as this calculates with 1.588 as an initial ambition with secondary, if bettered, up at 1.200.

In summary, it starts to appear UK Goods shall be extremely attractive as exports to Europe in the event of Brexit. Of course, whether anyone will be able to export from the start of November is the big question, if a trade arrangement  remains absent. Perhaps we shall witness the situation with small boats crossing the channel from Europe, loaded with illegal migrants then returning to France loaded with illegal Scotch & Gin!

FUTURES

Time Issued

Market

Price At Issue

Short Entry

Fast Exit

Slow Exit

Stop

Long Entry

Fast Exit

Slow Exit

Stop

Prior

10:07:23PM

BRENT

60.09


Success

10:11:02PM

GOLD

1464.7

1450

1444.5

1436

1462

1470

1479

1492

1454

Success

10:15:48PM

FTSE

7161.82


Success

10:24:28PM

FRANCE

5221.2


Success

10:28:05PM

GERMANY

11552.45


Success

10:36:24PM

US500

2826.02


Success

10:45:14PM

DOW

25566


Success

10:48:00PM

NASDAQ

7367.12

7351

7245

7131

7453

7477

7517

7553

7409

Success

10:50:05PM

JAPAN

20200


Success

5/08/2019 FTSE Closed at 7223 points. Change of -2.48%. Total value traded through LSE was: £ 6,514,005,349 a change of -7.03%

RBS for 5/08/2019

#DAX #BRENT Our previous report on RBS (link here) strongly suspected the price would reverse to 202p. It did, closing Friday at 202.9p! That’s 20p in old money (pre share split) for those who harbor a grudge. The share price is now pretty much at the level of 2009, when the stock market bottomed. Unfortunately for RBS, the share price has been playing chicken with the 2 quid level for a few years but has become dangerous.

There is a slight phenomena which gives some near term hope. The BLUE downtrend on the chart dates back to September 2008. Today, this line is at 200.047p and represents the level RBS share price needs actually close below to justify hysterics. Such a triggering event will make weakness down to an initial 180p calculate as an initial point at which we’d hope for a rebound. If (when) broken, the price should eventually bottom at 150p.

Unfortunately, in the perpetual limbo dance which is RBS, we can calculate lower than 150p… To be realistic, should it ever visit the 130’s, it would become a very tempting Long position to take, just to see what will happen.

For now though, some slight hope for a near term bounce is slightly possible, due to the respect paid to the long term BLUE downtrend from 2008. If we look for immediate clues as to whether any bounce has integrity, above 207.4p calculates with an initial ambition at 211.25p. If exceeded, secondary is a bit more useful and works out at 219p. This should rebound the price to a useful level, just above the RED uptrend and hint “bottom is in”, thus giving the potential of an unusual 3rd target level at 231p, along with some almost certain hesitation.

We suspect it intends 150p eventually, once sufficient excuses for reversal accumulate.

FUTURES

Time Issued

Market

Price At Issue

Short Entry

Fast Exit

Slow Exit

Stop

Long Entry

Fast Exit

Slow Exit

Stop

Prior

2:28:10PM

BRENT

61.21

61.14

60.815

60.12

62.2

62.91

63.335

64.45

61.51

2:33:38PM

GOLD

1441.19


2:36:19PM

FTSE

7402


2:45:43PM

FRANCE

5371


2:50:04PM

GERMANY

11919

11830

11751

11725

11935

11956

11993

12046

11856

2:55:47PM

US500

2934.92


2:59:21PM

DOW

26493


3:06:53PM

NASDAQ

7698.62


3:12:47PM

JAPAN

20926


2/08/2019 FTSE Closed at 7407 points. Change of -2.33%. Total value traded through LSE was: £ 7,006,818,506 a change of 7.38%

FTSE for 2/08/2019

#DAX #SP500 We’re now in that horrible time of year, when some idiot says “how many shopping days left until ….” whereas for traders, it’s “how many market sessions until I stop pulling my hair out!”. While the markets are always mad, this year exhibits a new type of insane, one neatly shown on Thursday 1st August.

Our beef came from market movements once the FTSE closed for the day. We’d given trigger levels for the US markets, all of which managed to be exceeded in the period before 6.30pm. Quite literally, triggers were exceeded briefly by a couple of points, then it felt like someone hit the pause button. News from the USA which proved perfectly capable of trashing the Futures left an unpleasant taste as it almost felt like the markets deliberately exceeded logical trigger levels, thus capturing a bunch of orders prior to a plunge. It begs the question, isn’t this called “entrapment” in legal terms?

It can be assumed we were not amused; writing “shambles” so many times in our Prior Results column was not enjoyable.

This particular article is supposed to be about “The FTSE for Friday” but we’re a little perplexed at what the future holds. At time of writing, FTSE FUTURES are trading around 7490 points whereas the FTSE closed the session at 7581 points.

Will the FTSE, therefore, open nearly a 100 points down?

If there any point in writing “Movement now below 7535 (the opening second spike down on the 1st) looks capable of an initial 7486 points.” After all, FTSE Futures have already reached such a level whereas the FTSE itself has not. The real problem for the FTSE starts, if 7486 breaks as further reversal down to 7323 points looks valid. However, there is a pretty fair chance the market shall experience a short lived bounce around 7425, due to the presence of the prior downtrend.

We suspect the market will probably make its way down to the 7486 level and perhaps bounce a little. If this is the case, movement to an initial 7540 shall make some sense. If exceeded, secondary is at 7558 points. Should this level be bettered (remembering, we are speculating on a FTSE bounce from a level the market has not even dropped to yet!) there is a more than fair chance the drop has been an over-reaction to whatever Mr Trump did.

Curiously, any reach down to 7323 will tend suggest a coming donk against the RED uptrend, one which should generate a reasonable rebound.

FUTURES

Time Issued

Market

Price At Issue

Short Entry

Fast Exit

Slow Exit

Stop

Long Entry

Fast Exit

Slow Exit

Stop

Prior

9:43:34PM

BRENT

61.05


Success

9:46:16PM

GOLD

1444.71


‘cess

9:50:33PM

FTSE

7503.69


Shambles

9:53:27PM

FRANCE

5474.2


‘cess

9:57:51PM

GERMANY

12073.45

12031

11992

11856

12120

12120

12141.5

12178

12058

Shambles

10:01:51PM

US500

2948.62

2944

2938

2908

2985

2977

2993.75

3001

2949

Shambles

10:04:47PM

DOW

26546


Success

10:07:10PM

NASDAQ

7780.62


‘cess

10:14:50PM

JAPAN

21028


‘cess

1/08/2019 FTSE Closed at 7584 points. Change of -0.03%. Total value traded through LSE was: £ 6,525,168,165 a change of -9.28%

Sirius Minerals for 1/08/2019

#Nasdaq #Gold Back in June, Sirius finally hit our 13p drop target, something (link here) we’d been moaning about since February! Crucially, it did not really break target (it hit 12.98) and exhibited a half decent bounce. But price moves are proving reminiscent of AIM shares whose price sees controlled by chatroom gossip.

It starts to appear the 17p level shall prove crucial anytime soon for Sirius. In the event the share price manages trade above such a level, recovery to an initial 19.70p calculates as comfortably possible. Our secondary, if such a level bettered, computes at 25.7p and we suspect a rise will falter around such a level. Surprisingly, future recovery beyond this point looks like growth in 10p increments, something which we simply do not understand.

Otherwise, the problem level of 13p remains an issue until such time Sirius manages close a session above 18p. We’d be inclined to take this as a pretty solid movement into safety, even though the price has not exceeded BLUE on the chart.

Below 13p and it still looks like Sirius shall eventually bottom at 4p.

FUTURES

Time Issued

Market

Price At Issue

Short Entry

Fast Exit

Slow Exit

Stop

Long Entry

Fast Exit

Slow Exit

Stop

Prior

10:32:18PM

BRENT

64.29


10:34:23PM

GOLD

1414.67

1410.5

1405

1395.34

1428

1434

1441.29

1451

1414

Success

10:36:15PM

FTSE

7571.34


Success

10:38:30PM

FRANCE

5506.5


‘cess

10:41:50PM

GERMANY

12128


‘cess

10:47:25PM

US500

2973.42


Success

10:51:32PM

DOW

26826


Shambles

10:53:54PM

NASDAQ

7828.99

7769

7734

7634

7908

7908

7959.5

8023

7821

Success

10:57:26PM

JAPAN

21338


Success

31/07/2019 FTSE Closed at 7586 points. Change of -0.78%. Total value traded through LSE was: £ 7,192,499,053 a change of 21.96%

Centrica for 31/07/2019

#SP500 #Japan When we last covered this potential disaster (and dodgy chart pattern) in May (link here), nerves were expressed regarding the share price future. A hopeful bottom of 82p had been designated as important, essentially as further drop potentials were really quite messy. In fact, 28p and less were mentioned as further drop targets!

Without a doubt, things have now gotten messy with the loss of their Chief Executive, a large pre-tax loss, and reportedly large numbers of customers unplugging from the company. Thankfully, their CEO was awarded a 44% pay rise in the last year, an award which will doubtless work wonders for staff moral within a company frantically attempting to put a positive spin on a pretty rotten day on the markets.

The situation now is dangerous but we are able to offer a slight glimmer of hope. The immediate situation suggests ongoing weakness below 73p should find its way to 63p next and hopefully, exhibit a bounce. Once again, we advocate extreme caution of 63p breaks as any bounce is liable to be short lived. Instead, there is the potentials for freefall down to a bottom (hopefully) at 28p.

In our opening paragraph, we mentioned a “Dodgy Chart Pattern”, something easily missed as it covers the period since 2003. The chart below shows the price has experienced a painfully clear Double Top from 2003 to 2015. Some people swear by this sort of thing, most people swear at this sort of thing but there is always the risk of Pattern Believers creating a self fulfilling prophecy. In the case of Centrica, it calculates with “Ultimate Bottom” down at 12p. We suspect most folk will be happy to fill up with Centrica shares if it ever actually achieved such a ridiculous number but, in the grand scheme of things, our own potential of 28p is pretty blooming close.

To get out of this mess, Centrica needs exceed 108p at present.


FUTURES

Time Issued

Market

Price At Issue

Short Entry

Fast Exit

Slow Exit

Stop

Long Entry

Fast Exit

Slow Exit

Stop

Prior

9:48:50PM

BRENT

64.93


Success

9:50:57PM

GOLD

1431.01


‘cess

9:52:55PM

FTSE

7650.76


9:56:15PM

FRANCE

5499.7


Success

10:04:17PM

GERMANY

12130


Success

10:05:46PM

US500

3014.07

3000

2996.5

2986

3014

3017

3022.5

3030

3006

Success

10:12:17PM

DOW

27229.8


Success

10:19:02PM

NASDAQ

7976


Success

10:20:49PM

JAPAN

21509

21476

21457.5

21350

21535

21609

21643

21702

21542

‘cess

30/07/2019 FTSE Closed at 7646 points. Change of -0.52%. Total value traded through LSE was: £ 5,897,611,362 a change of 3.5%