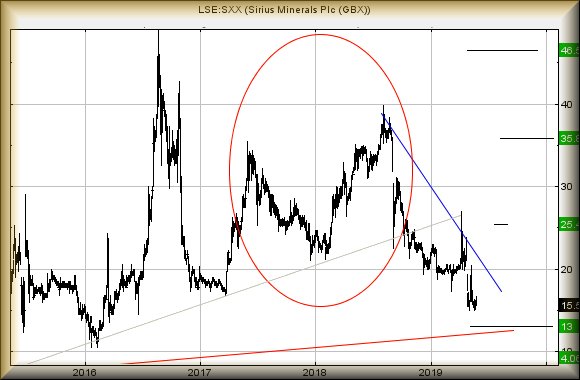
#SP500 #DAX Our last in-depth look at Sirius was back in February at 20p (link here) and it has been getting seriously close to our 13p target. Interestingly, since their Open Offer deal, a few pundits are suggesting the share price is now undervalued, even proposing some interesting rise potentials. So, is it at bottom?

To be honest, we’re not sure. The price is certainly hovering at the 15p level, giving an indication a “floor” has been found. With our distrust of the way in which the market treats investors, we’d be uncomfortable suggesting it’s at bottom, if only due to the price floundering around in “lower low” territory. There can be little doubt trades now below 14.95p should provoke reversal to 13p and visually a bounce.
Consider this. If the price were somehow to close below 13p, actual bottom should prove to be at around 4p!
The folk who believe in chart patterns should not be confused with those who follow horoscopes or technical indicators. Quite often, a complex sounding chart pattern is simply describing a logical mental process. The current one potentially effecting SXX is circled in RED on the chart. The first peak is the “Hey, I don’t think it will get higher, I’m taking profit” sentiment. The second peak echoes the initial one. And the third peak is fairly simple; “It’s had a good run, don’t trust it now, I’m out of here”.
At this point, another force takes over; “Ooops, it has broken the immediate uptrend again. Think I’ll just wait and see.”
And before you know it, you’ve got a classic Head & Shoulders formation, one which points at reversal to 4p eventually. Essentially, it’s entirely based on how a trader will view price movements, along with the emotional cycle. More often than not, it works out, even if you have to squint a bit to recognise the chart pattern.
Our own thinking is of reversal coming to 13p anytime soon, along with a bounce at such a point. The RED uptrend dates back to 2010 and should prove perfectly capable for traders to pile in, with the belief such a long term uptrend must provoke a rebound.
At present, any rebound exceeding 22p should bring a visit to an initial 25.5p. If exceeded, secondary calculates at 35p in the future. In fact, we can even compute a best case scenario at 46p, a point where we’d again stir the tea leaves.
For now, it feels like 13p shall prove worth watching for.

|
Time Issued |
Market |
Price At Issue |
Short Entry |
Fast Exit |
Slow Exit |
Stop |
Long Entry |
Fast Exit |
Slow Exit |
Stop |
Prior |
|
10:33:06PM |
BRENT |
68.18 |
Success | ||||||||
|
10:34:48PM |
GOLD |
1280.47 | |||||||||
|
10:38:02PM |
FTSE |
7187.2 |
Success | ||||||||
|
10:40:04PM |
FRANCE |
5234.5 |
Success | ||||||||
|
10:48:57PM |
GERMANY |
11856.68 |
11809 |
11774 |
11658 |
11930 |
11961 |
11988.5 |
12049 |
11846 |
Success |
|
10:55:07PM |
US500 |
2780.02 |
2765 |
2747 |
2732 |
2805 |
2806 |
2817.5 |
2835 |
2778 |
Success |
|
11:01:20PM |
DOW |
25105 |
Success | ||||||||
|
11:03:48PM |
NASDAQ |
7208.92 |
Success | ||||||||
|
11:05:23PM |
JAPAN |
20897 |
Success |
One Reply to “Sirius Minerals for 30/05/2019”