FTSE for FRIDAY 6/09/2019

#DAX #Nasdaq When reading a FT journalist comment about UK Politics never being so chaotic ‘since time began’, a brief memory of the 1970’s/80’s surfaced. Lots of General Elections, power cuts, food panics, fuel ration books, inflation, a mindset eventually leading to the widely known (rarely reported) ‘secret’ UK soldiers deployed, dressed as civilian policemen to “fight” striking miners in the earlier 1980’s. Somehow, our current shambles just isn’t the same!

The 70’s and early 80’s were “interesting times” with some real brinksmanship, unlike today, where we appear to be led by folk without gravitas or statesman like quality. But we do have a media, determined to pretend things have never been so bad as they are now. The purveyors of panic in the media must be experiencing a frisson of delight, if only due to the FTSE being DOWN 0.6% on a day the DOW was UP 1.6%.

In the last few days, the UK market has been challenging. But on Wednesday evening, we threw the toys from the pram and lied to ourselves with what was perhaps the most stupid logic available. The problem was, Thursday calculated as being an UP day on the FTSE. Everything pointed to this being possible. As a result, we adopted the stance of expecting a DOWN day! Our thinking was fairly basic, if UK market seems to be holding itself in place, neither accelerating upward nor downward. The logic by which upward travel was supposed to happen presented a scenario with continued growth possible to the 7700’s. Surely, a market which was awaiting guidance, would avoid this scenario and instead head downward.

It did.

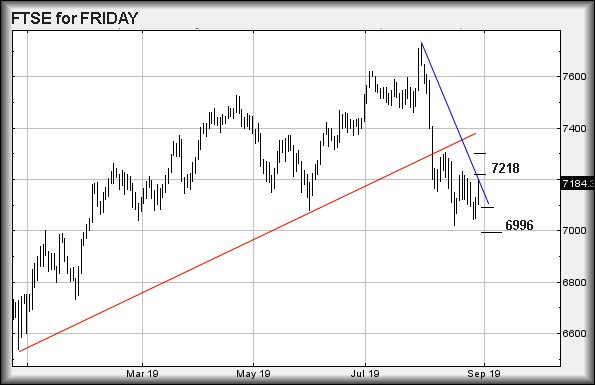
Closing Thursday at 7265, there is now a problem if the FTSE makes its way below 7240. We can calculate travel down to an initial 7213 points with secondary, if broken, at 7174 points. Visually this appears not terribly traumatic and thus, there’s a reasonable chance of it happening.

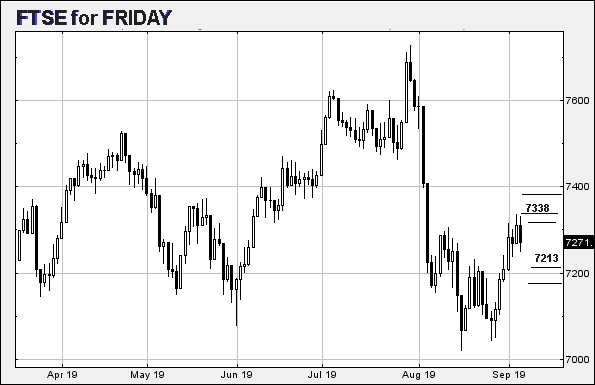
However, if the market opts to remain marching on the spot, above 7289 is supposed to bring an initial 7313 points with secondary, if bettered, at 7338 points. As the chart below highlights, neither target level challenges the hiatus which has been the first few days of September. As a result, we suspect this shall be the route taken.

Above 7338 should prove interesting, breaking from trend and expecting 7390 points. We doubt it.

FUTURES

Time Issued

Market

Price At Issue

Short Entry

Fast Exit

Slow Exit

Stop

Long Entry

Fast Exit

Slow Exit

Stop

Prior

10:11:06PM

BRENT

60.57


Success

10:12:57PM

GOLD

1519.7


Success

10:16:11PM

FTSE

7248.68


Shambles

10:19:13PM

FRANCE

5584


Success

10:22:17PM

GERMANY

12110

12066

12040

11999

12135

12140

12177.25

12284

12076

Success

10:24:38PM

US500

2969.72


Success

10:29:09PM

DOW

26686


Success

10:40:03PM

NASDAQ

7847

7730

7652.5

7576

7833

7882

7904

7915

7760

Success

10:43:31PM

JAPAN

21131


Success

5/09/2019 FTSE Closed at 7271 points. Change of -0.55%. Total value traded through LSE was: £ 5,601,988,154 a change of -7.64%

YouGov for 5/09/2019

#CAC40 #Nasdaq As our ‘great nation’ crawls pitifully toward elections or referendum, it’s easy to remember we used to elect people who did stuff. A clear winner from the UK’s political incompetence has been polling companies, so we’re reviewing YouGov as their share price is reaching new highs.

At present, YouGov is showing itself as a little problematical!

The Big Picture had given a “maximum” target level of 622p and the share price has come within such an ambition level, certainly in the range of a “margin for error” so beloved by their statistical people. Near term, there’s little doubt continued traffic above 611p should attain the 622p level anyway but our puzzlement is due to a certain lack of market intervention at present. Essentially, if the market wished YouGov to exceed 622p we would expect the share price to be manipulated upward at the open.

Instead, the best witnessed during August were a couple of little nods upward, one by 3p and another by 4p. Neither movement is particularly substantial and makes us suspect, if 622p makes an appearance, we should expect some volatility around such a level, if only to generate future impetus for another rise. Above 622p and we can calculate a secondary, a very suspect 640p. With the best will in the world, we cannot calculate higher.

Of course, just because we run out of numbers does not mean a price cannot go higher. Our arrogance has its limits but generally, the market would already be stretching a price’ potentials by gapping it up at the open.

To indicate trouble ahead, YouGov needs trade below 539p, this risking reversal to an initial 506p. If broken, secondary is at 471p. For now, we suspect it shall prove to be a short opportunity for a while, if 622p appears. Visually, it will make sense if the price bounces between 545 and just above 600 for a while, at least until our wonderful leadership decide how firmly they wish to delay making another decision.

FUTURES

Time Issued

Market

Price At Issue

Short Entry

Fast Exit

Slow Exit

Stop

Long Entry

Fast Exit

Slow Exit

Stop

Prior

9:49:29PM

BRENT

60.35


Success

9:51:09PM

GOLD

1552.99


‘cess

9:53:17PM

FTSE

7308.77


9:55:03PM

FRANCE

5537.2

5496

5489

5473

5526

5538

5548.5

5564

5505

Success

9:57:05PM

GERMANY

12043.49


Success

9:58:31PM

US500

2938.67


Success

10:01:49PM

DOW

26368


10:03:14PM

NASDAQ

7719.67

7641

7626.5

7593

7692

7727

7750.5

7808

7660

‘cess

10:05:14PM

JAPAN

20816


‘cess


4/09/2019 FTSE Closed at 7311 points. Change of 0.59%. Total value traded through LSE was: £ 6,065,530,501 a change of 23.23%

Fevertree for 4/09/2019

#FTSE #DOW There is a 100% certainty an asteroid shall impact the Earth. As for when, that’s the big question as no-one can put a timeframe on it. Similarly with Fevertree, we’re pretty comfortable the price is going to head down. But again, the issue of timeframes arises! Thankfully, we can ameliorate the proposal by examining the logic behind the drop potentials.

Firstly, there’s the RED uptrend. The share has broken below RED and failed to close above the trend in the period since trend break. This is not encouraging and suggests the presence of weakness.

Secondly, perhaps more importantly, two quite separate Big Picture arguments calculate with a drop potential of 1212p. This is quite a scary proposition, not only allowing the price to nearly half from current but worse, it will reside in a zone where negative news allows an ultimate bottom at 159p!

Third, there’s the horizontal trend, something we increasingly trust. It’s painted on the chart as a Purple Dashed Line. (It might be Magenta, we’re still arguing)

The horizontal trend is at 2073p. In the event Fevertree closes below this line, we are inclined to view this as the final straw, expecting it to trigger reversal to an initial 1632p with secondary, when broken, down at 1212p. We would expect some sort of bounce at the 1632p level but if it breaks, any rebound risks being short lived.

To get out of trouble, Fevertree requires a miracle recovery above the historical RED uptrend. At present, this is around 2517p. Such a movement allows growth to an initial 2966p with secondary, if bettered, a happier looking 3372p.


FUTURES

Time Issued

Market

Price At Issue

Short Entry

Fast Exit

Slow Exit

Stop

Long Entry

Fast Exit

Slow Exit

Stop

Prior

10:15:34PM

BRENT

58.08


‘cess

10:17:51PM

GOLD

1547.55


Success

10:20:44PM

FTSE

7272.94

7206

7194

7153

7240

7317

7353

7403

7235

10:22:13PM

FRANCE

5472


Success

10:24:08PM

GERMANY

11926


10:26:13PM

US500

2904.82


10:33:57PM

DOW

26090

26058

25986.5

25797

26245

26286

26383.5

26521

26113

‘cess

10:35:49PM

NASDAQ

7615.14


10:37:48PM

JAPAN

20593


3/09/2019 FTSE Closed at 7268 points. Change of -0.18%. Total value traded through LSE was: £ 4,922,266,781 a change of 24.21%

Versarien for 3/09/2019

Versarien PLC (LSE:VRS) Sometimes, the glaringly obvious takes a while. In a return to “chart basics”, Versarien price movements remind when trend lines might actually prove important. As the chart below highlights, at first glance it appears we’ve lost our minds.

Against most shares, a trend line is defined fairly easily. A downtrend maps the Highs of each session. An uptrend maps the Lows of each session. And generally, these are the only two trend lines which matter, when trying to make sense of price movements.

On the other hand, there’s Versarien.

When we review price movements since 2017, this share appears to be mapped by closing price with neither the High of the Day or the Low of the Day getting a look in. Hopefully the lower chart which simply shows Closing Prices serves to illustrate why this should prove interesting for the future. The implication is fairly straightforward. If Versarien closes above BLUE or below RED, it shall give a pretty solid clue the trend has actually changed with plans being made accordingly.

At present, closure below 100p would prove a poor show, taking the share into a region where reversal to an initial 94p makes sense. If broken, secondary is at 80p, along with the hope of a real bounce. But the problem for the longer term will come, if it ever closes below 80p. Such a calamity will open the door for reversal toward 54p initially with secondary an “ultimate” bottom of 21p. At present, nothing suggests this is possible.

The other side of the coin comes with closure above 125p as this should propel the price to an initial 133p. Secondary, if bettered, calculates at 153p.

For now, it’s messing around and simply avoiding showing direction.

FUTURES

Time Issued

Market

Price At Issue

Short Entry

Fast Exit

Slow Exit

Stop

Long Entry

Fast Exit

Slow Exit

Stop

Prior

9:37:26PM

BRENT

58.55


‘cess

9:39:18PM

GOLD

1529.42

1519

1516

1510

1527

1532

1533.865

1538

1523

9:41:24PM

FTSE

7277.66


‘cess

10:15:53PM

FRANCE

5480.2


10:17:50PM

GERMANY

11947


10:19:51PM

US500

2899

2888

2881.5

2860

2919

2926

2942

2965

2904

Success

10:23:24PM

DOW

26177.6


Success

10:26:59PM

NASDAQ

7610.34


‘cess

10:29:16PM

JAPAN

20539


‘cess

2/09/2019 FTSE Closed at 7281 points. Change of 1.03%. Total value traded through LSE was: £ 3,962,859,546 a change of -28.76%

Kaz Minerals for 2/09/2019

#FTSE #BRENT It’s difficult reviewing many of the Mining Sector without flinching a little at their overall prospects. Kaz is a case in point as the Big Picture presently indicates some reversal as viable and we’ve a problem. Our targets will see the share price decline below the uptrend since 2016 and this will be arithmetically bad.

The issue we have with the share is fairly straightforward. If the price of KAZ closes below RED on the chart, ultimate bottom – from a Big Picture perspective – calculates at Minus 215p, obviously an impossible ambition. Unfortunately, once shares start to perform in a region where “ultimate bottoms” are prefaced with minus signs, some truly irrational price moves can occur. For example, witness the current mad swings experienced by Thomas Cook, a share with a pretty solid bottom target in negative numbers!

At present, the ruling uptrend (RED) for KAZ calculates at 345p. Closure below this trend risks some troubling movements and at present, there’s a problem. Weakness anytime now below 376p will be regarded as entering a cycle to an initial 305p. If broken, secondary calculates at 270p, a point we’d normally hope for a bounce. 

The big issue is both target ambitions afford the share the chance of closing below RED, trapping the price in a zone where it shall need some sort of miracle to escape. At time of writing, KAZ is at 402p, looking fairly safe. We have our doubts, if only due to the visual risk of “lower lows”.

If there are to be any near term surprises, apparently above 408p should provoke a rise to 414p soon. In itself, an utterly useless movement but one which should trigger a near term secondary at 435p, perhaps even 480p if riding on the back of stronger commodity prices. We’re not breathless with anticipation and suspect 305p shall make an appearance eventually.

FUTURES

Time Issued

Market

Price At Issue

Short Entry

Fast Exit

Slow Exit

Stop

Long Entry

Fast Exit

Slow Exit

Stop

Prior

2:01:48PM

FTSE

7231

7175

7150

7120

7235

7241

7268.5

7349

7175

2:05:08PM

BRENT

59.09

58.48

58.04

57.32

59.73

60.64

61.445

62.44

59.34

‘cess

2:09:26PM

GOLD

1520.79


2:33:22PM

FRANCE

5495.2


‘cess

2:43:58PM

GERMANY

11964


‘cess

2:46:28PM

US500

2922.92


‘cess

2:50:35PM

DOW

26395


‘cess

2:54:11PM

NASDAQ

7670.87


‘cess

2:56:35PM

JAPAN

20668


‘cess

30/08/2019 FTSE Closed at 7207 points. Change of 0.32%. Total value traded through LSE was: £ 5,562,641,107 a change of 12.91%

FTSE for 30/08/2019

#CAC40 #DOW It was amusing, seeing the UK stock market celebrate the resignation of Ruth Davidson (their “leader” in Scotland) with a fairly substantial upward day. Her main claim to fame was eradicating the word “Conservative” from leaflets, replacing it with the silly ‘Ruth Davidsons Party’. Vote share didn’t change, even slightly, and the Conservatives remained languishing in the gutter, out of power in Scotland since 1955. Somehow, the media never mention that detail. Then again, perhaps the UK market rise was influenced by Trump and his stance against China as he once again made a tariff threat, trashed the markets, allegedly rescinded the threat, and markets were happy again.

Or are they?

The FTSE experienced a flamboyant day by any standards but we’re concerned it did not exceed 7,200 points. The high of the day proved to be 7,199 and while market futures hit out initial lunchtime projection pretty exactly, we were not filled with confidence, instead worrying the FTSE was simply going through the motions in sympathy to other world markets. Basically, we would have expected better on the day. We mentioned recently our rule of thumb, where an initial surge exceeding a target gives a pretty solid clue for what’s coming next. While the FTSE matched our target on the initial surge, it failed to better it. Even FTSE futures, normally gifted with excess, only achieved 7200.08 on the initial surge to target.

We’re therefore not bursting with optimism for Friday.

Movement on the FTSE above 7,201 should reach a boring sounding 7,218 points. If exceeded, life becomes more interesting as the secondary calculates at an amazing 7,301 points! Visually, we would expect some hesitation around the 7,237 mark, due to the presence of prior highs recently.

If triggered, the very tightest stop is at 7,163 points but realistically, we’d prefer wider at 7,144 points – or even 7,126 if embracing true paranoia.

What happens if the FTSE breaks below 7,126 points? The next bit requires a stop level at 7,190 points.

Initially, we’re calculating the potential of reversal to an initial 7,089 points. At this point, it gets nasty as any break below this level risks a longer term cycle down to 6,996 points.

Importantly, we’re at the end of a month and things tend finish with a flourish.

It’s the Belgian GP this weekend, welcome relief from the chaos which is apparently the UK.


FUTURES

Time Issued

Market

Price At Issue

Short Entry

Fast Exit

Slow Exit

Stop

Long Entry

Fast Exit

Slow Exit

Stop

Prior

10:33:38PM

BRENT

60.41


10:35:19PM

GOLD

1528.43


Sorry

10:44:19PM

FTSE

7189


Success

10:48:13PM

FRANCE

5448

5396

5386.5

5362

5440

5460

5479

5525

5397

Success

10:49:58PM

GERMANY

11859


Success

10:56:54PM

US500

2923.87


Success

10:59:07PM

DOW

26359

26145

26061.5

25945

26346

26411

26496.5

26659

26240

Success

11:01:23PM

NASDAQ

7702


Success

11:03:29PM

JAPAN

20676


Success


29/08/2019 FTSE Closed at 7184 points. Change of 0.98%. Total value traded through LSE was: £ 4,926,670,001 a change of -7.06%

RBS for 29/08/2019

#FTSE #Nasdaq Increasingly, we warn of a scenario when a price meets and exceeds our initial target ambition. The reasoning is fairly basic. If a price exceeds an initial target, the secondary becomes exceedingly viable, if not inevitable, eventually. Obviously, spanners are occasionally thrown but it’s a good rule of thumb.

On the day RBS hit our 180p (prior report), it actually broke below and bounced (with a remarkable lack of enthusiasm) from 177p. To us, this was not a comforting sign as it once again suggests RBS intends a bottom at 150p. There is, perhaps, a crumb of comfort showing as the uptrend since 2009 (shown in RED) is presently at 168.798p and there’s little doubt any near term fall to this level will doubtless exhibit some sort of rebound, if only due to the number of folk capable of drawing a straight line.

We fear they shall be wrong; the attraction of 150p has been evident for some time. Worse, if 150p breaks, the absolute “it must bounce here” point calculates at 134p. Please remember, this is a retail (and political) bank and perfectly capable of playing by illogical rules.

Of course, perhaps we are being too gloomy in our thoughts and instead, should search for hope amongst this grim collection of numbers. At present, we shall be watching if the share price exceeds 189p as this is supposed to trigger recovery to 196p. While fairly useless as a price movement, if 196p is exceeded, it ticks the first box for “bottom is in”, giving hope we shall witness stronger movement toward 220p and the land of unicorns, princesses, and golden glitter.

FUTURES

Time Issued

Market

Price At Issue

Short Entry

Fast Exit

Slow Exit

Stop

Long Entry

Fast Exit

Slow Exit

Stop

Prior

10:03:37PM

BRENT

59.89


‘cess

10:13:31PM

GOLD

1540


10:16:15PM

FTSE

7106

7046

7017

6978

7093

7134

7154

7197

7047

10:18:07PM

FRANCE

5368.2


10:20:43PM

GERMANY

11687


10:29:21PM

US500

2883.52


10:37:09PM

DOW

26020.3


10:48:21PM

NASDAQ

7576.25

7535

7488.5

7438

7594

7602

7634

7680

7550

‘cess

10:50:22PM

JAPAN

20500


‘cess

28/08/2019 FTSE Closed at 7114 points. Change of 0.35%. Total value traded through LSE was: £ 5,300,760,718 a change of -31.12%