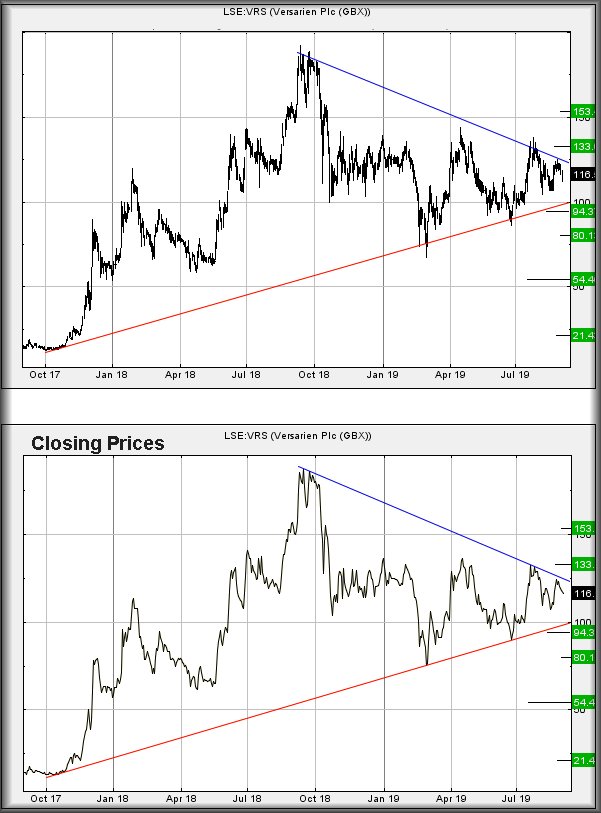
Versarien PLC (LSE:VRS) Sometimes, the glaringly obvious takes a while. In a return to “chart basics”, Versarien price movements remind when trend lines might actually prove important. As the chart below highlights, at first glance it appears we’ve lost our minds.
Against most shares, a trend line is defined fairly easily. A downtrend maps the Highs of each session. An uptrend maps the Lows of each session. And generally, these are the only two trend lines which matter, when trying to make sense of price movements.
On the other hand, there’s Versarien.
When we review price movements since 2017, this share appears to be mapped by closing price with neither the High of the Day or the Low of the Day getting a look in. Hopefully the lower chart which simply shows Closing Prices serves to illustrate why this should prove interesting for the future. The implication is fairly straightforward. If Versarien closes above BLUE or below RED, it shall give a pretty solid clue the trend has actually changed with plans being made accordingly.
At present, closure below 100p would prove a poor show, taking the share into a region where reversal to an initial 94p makes sense. If broken, secondary is at 80p, along with the hope of a real bounce. But the problem for the longer term will come, if it ever closes below 80p. Such a calamity will open the door for reversal toward 54p initially with secondary an “ultimate” bottom of 21p. At present, nothing suggests this is possible.
The other side of the coin comes with closure above 125p as this should propel the price to an initial 133p. Secondary, if bettered, calculates at 153p.
For now, it’s messing around and simply avoiding showing direction.
|
Time Issued |
Market |
Price At Issue |
Short Entry |
Fast Exit |
Slow Exit |
Stop |
Long Entry |
Fast Exit |
Slow Exit |
Stop |
Prior |
|
9:37:26PM |
BRENT |
58.55 |
‘cess | ||||||||
|
9:39:18PM |
GOLD |
1529.42 |
1519 |
1516 |
1510 |
1527 |
1532 |
1533.865 |
1538 |
1523 | |
|
9:41:24PM |
FTSE |
7277.66 |
‘cess | ||||||||
|
10:15:53PM |
FRANCE |
5480.2 | |||||||||
|
10:17:50PM |
GERMANY |
11947 | |||||||||
|
10:19:51PM |
US500 |
2899 |
2888 |
2881.5 |
2860 |
2919 |
2926 |
2942 |
2965 |
2904 |
Success |
|
10:23:24PM |
DOW |
26177.6 |
Success | ||||||||
|
10:26:59PM |
NASDAQ |
7610.34 |
‘cess | ||||||||
|
10:29:16PM |
JAPAN |
20539 |
‘cess |