#Brent #SP500 Wall to wall sunshine decorated Argyll over the last few days, providing a sharp reminder of how pretty the area is when it’s not cloudy and raining. The sharpness of the reminder came courtesy of the temperature, the lawn remaining white with frost until 1pm and when it got dark after 4.30pm, the ground froze white again. In other words, it is time to wear gloves and a hat again when walking the dogs. Or winter, as we call it locally.
Thankfully, Barclays appears to be extracting itself from the long winter experienced since 2010, having successfully attained our our primary AND secondary targets given in our analysis three weeks ago. Despite the share price closing above our secondary target, there now appears to be some effort being made to slow down the pace of rise. From a fairly near term perspective, below 409p risks promoting reversals to an initial 391p with our secondary, if broken, at a hopefully rebound bottom of 378p. Share price closure below 378p risks introducing real danger to the report, giving the threat of Big Picture reversals to an initial 320 with our secondary, if broken, at 284p. The trouble from such a notion is the risk of the price moving below the Blue trend break level of 307p, absolutely stuffing share price recovery prospects.
Hopefully current movements simply mirror the market attempting to slow down the banks prospects until such time the Bank of England lightens its battle to keep the UK economy depressed, bring a reduction in Interest Rates at the next BoE meeting on 18th December. Perhaps an inept budget by Rachel from Accounts shall make an interest rate reduction essential?
From a more immediate perspective, above 424p should be useful, triggering movement to an initial 454p with our secondary, if exceeded, at a future 505p. From a Big Picture perspective, we shall view a distant sounding 580p as exerting an eventual attraction.
In summary, we suspect current events shall prove short lived and Barclays will commence further gains, once they find the correct excuse.

FUTURES
FUTURES
| Time Issued | Market | Price At Issue | Short Entry | Fast Exit | Slow Exit | Stop | Long Entry | Fast Exit | Slow Exit | Stop |
| 1:37:18AM | BRENT | 6409.5 | 6226 | 6209 | 6077 | 6433 | 6531 | 6655 | 6799 | 6313 |
| 1:42:32AM | GOLD | 4082.96 | ||||||||
| 1:53:14AM | FTSE | 9690.5 | ||||||||
| 2:00:17AM | STOX50 | 5683.3 | ||||||||
| 2:03:02AM | GERMANY | 23839.9 | ||||||||
| 2:07:32AM | US500 | 6743.3 | 6652 | 6574 | 6458 | 6722 | 6775 | 6799 | 6848 | 6723 |
| 2:18:25AM | DOW | 47185 | ||||||||
| 2:38:00AM | NASDAQ | 25053.6 | ||||||||
| 2:40:15AM | JAPAN | 50423 |
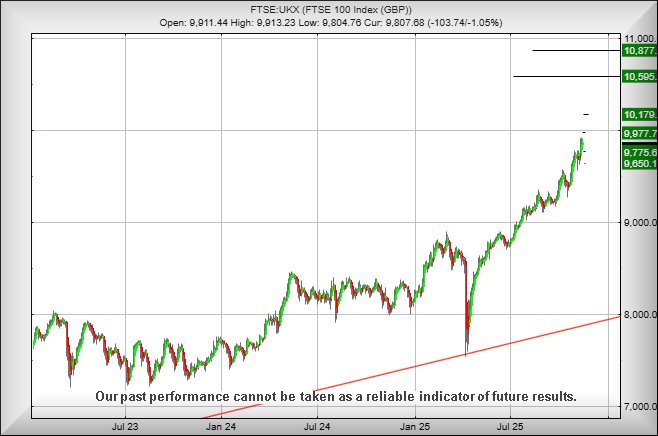
14/11/2025 FTSE Closed at 9698 points. Change of -1.11%. Total value traded through LSE was: £ 6,306,721,574 a change of 10.93%
13/11/2025 FTSE Closed at 9807 points. Change of -1.05%. Total value traded through LSE was: £ 5,685,178,464 a change of -6.33%
12/11/2025 FTSE Closed at 9911 points. Change of 0.12%. Total value traded through LSE was: £ 6,069,423,545 a change of -4.91%
11/11/2025 FTSE Closed at 9899 points. Change of 1.14%. Total value traded through LSE was: £ 6,382,591,388 a change of 4.7%
10/11/2025 FTSE Closed at 9787 points. Change of 1.08%. Total value traded through LSE was: £ 6,095,878,551 a change of 4.62%
7/11/2025 FTSE Closed at 9682 points. Change of -0.54%. Total value traded through LSE was: £ 5,826,630,107 a change of -16.85%
6/11/2025 FTSE Closed at 9735 points. Change of 896.42%. Total value traded through LSE was: £ 7,007,707,852 a change of 6.36% 
SUCCESS above means both FAST & SLOW targets were met. ‘CESS means just the FAST target met and probably the next time it is exceeded, movement to the SLOW target shall commence.
Our commentary is in two sections. Immediately below are today’s updated comments. If our commentary remains valid, the share can be found in the bottom section which has a RED heading. Hopefully, this will mean you no longer need to flip back through previous reports. HYPERLINKS DISABLED IN THIS VERSION
Please remember, all prices are mid-price (halfway between the Buy and Sell). When we refer to a price CLOSING above a specific level, we are viewing the point where we can regard a trend as changing. Otherwise, we are simply speculating on near term trading targets. Our website is www.trendsandtargets.com.
UPDATE. We often give an initial and a secondary price. If the initial is exceeded, we still expect it to fall back but the next time the initial is bettered, the price should continue to the secondary. The converse it true with price drops.
We can be contacted at info@trendsandtargets.com. Spam filters set to maximum so only legit emails get through…
Section One – Outlook Updated Today. Click here for Section Two – Outlook Remains Valid shares
Click Epic to jump to share: LSE:AZN Astrazeneca** **LSE:EXPN Experian** **LSE:QED Quadrise** **LSE:RR. Rolls Royce** **LSE:SAGA SAGA Plc** **LSE:WG. Wood Group** **LSE:ZOO Zoo Digital** **
********
Updated charts published on : Astrazeneca, Experian, Quadrise, Rolls Royce, SAGA Plc, Wood Group, Zoo Digital,
LSE:AZN Astrazeneca. Close Mid-Price: 13532 Percentage Change: + 0.28% Day High: 13574 Day Low: 13408
All Astrazeneca needs are mid-price trades ABOVE 13574 to improve acceler ……..
</p
View Previous Astrazeneca & Big Picture ***
LSE:EXPN Experian Close Mid-Price: 3342 Percentage Change: -0.45% Day High: 3346 Day Low: 3297
If Experian experiences continued weakness below 3297, it will invariably ……..
</p
View Previous Experian & Big Picture ***
LSE:QED Quadrise. Close Mid-Price: 2.98 Percentage Change: + 0.51% Day High: 2.97 Day Low: 2.76
In the event Quadrise experiences weakness below 2.76 it calculates with ……..
</p
View Previous Quadrise & Big Picture ***
LSE:RR. Rolls Royce Close Mid-Price: 1106 Percentage Change: -1.29% Day High: 1112.5 Day Low: 1083
If Rolls Royce experiences continued weakness below 1083, it will invaria ……..
</p
View Previous Rolls Royce & Big Picture ***
LSE:SAGA SAGA Plc. Close Mid-Price: 249 Percentage Change: + 1.63% Day High: 250 Day Low: 237
Continued weakness against SAGA taking the price below 237 calculates as ……..
</p
View Previous SAGA Plc & Big Picture ***
LSE:WG. Wood Group. Close Mid-Price: 22.42 Percentage Change: + 2.09% Day High: 22.2 Day Low: 21.36
In the event Wood Group experiences weakness below 21.36 it calculates wi ……..
</p
View Previous Wood Group & Big Picture ***
LSE:ZOO Zoo Digital Close Mid-Price: 9.75 Percentage Change: -4.88% Day High: 10.25 Day Low: 9.25
Target met. Continued weakness against ZOO taking the price below 9.25 ca ……..
</p
View Previous Zoo Digital & Big Picture ***