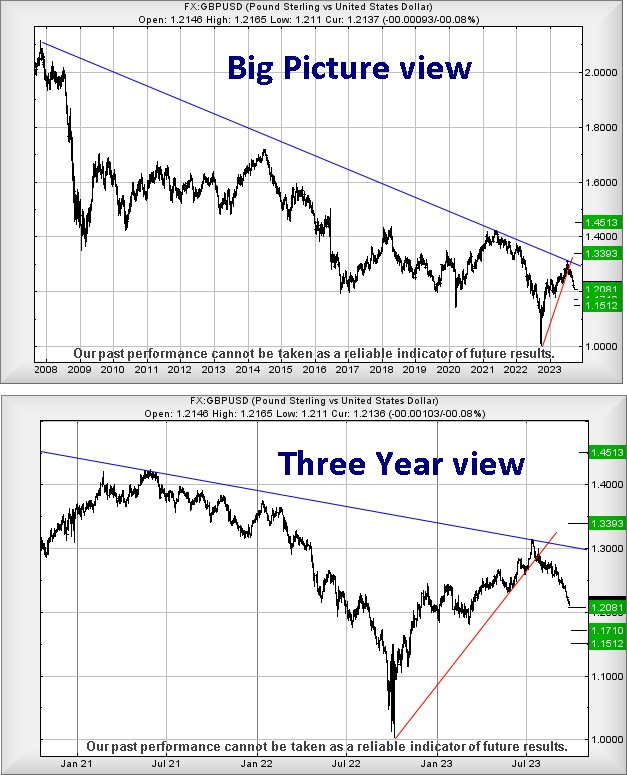
#Stoxx50 #DAX There are times when it can pay dividends to take a really big picture view of something. Back in January, we reviewed Sterling vs US Dollar with a calculation which suggested the price risked challenging the Blue downtrend. As the months rolled beneath us, the pairing eventually issued such a challenge, topping out at 1.315 in July before retreating in confusion. What interested us about this was our calculation, back in January, gave 1.333 as a viable ambition, this number obviously declining every month. When the relationship hit 1.315, we’d no calculations giving such an ambition and the only thing capable of provoking reversal was the Blue downtrend.
Sometimes, trend lines can be important, especially as our raison d’être is to monitor how prices are reacting to trend lines. Sometimes, after all, they can just be meaningless crayon lines but in this instance, it seems clear the markets are regarding Blue as important. Should this be the case, Blue currently represents a level of 1.3039.229 (roughly) and above such, it seems a Long position should reward anyone speculating.
After all, it’s not often we are presented with tangible proof the market views a particular trend line as important.
Alas, since the relationship attempted a challenge of Blue, things appear be going horribly wrong for Sterling as its retreat against the US Dollar has proven quite merciless. Currently, it’s the case where below 1.2110 presents the potential of relaxation to an initial 1.2081. While this isn’t a massive drop in the grand scheme of things, a visit to 1.2081 will represent a price level around which we’d conventionally hope for a solid bounce. The implication, should 1.2081 break, allows our calculation giving 1.1710 as viable. And should this level be trashed, we can even supply a third drop target at 1.1512 as a point by which the pairing really must rebound. Unfortunately, if daring to ride this dodgy gravy train to the bottom, it appears the tightest stop loss level shall require to be quite wide at 1.2880 though there’s a vague chance 1.2556 shall suffice for a bunch of complex reasons.
Our reading of the recovery prospects is muddied by a demand to take a time element into consideration. Above 1.2556 calculates with the potential of a lift to 1.2976, potentially with the chance of breaking above Blue on the chart and triggering some proper recovery for Sterling. Such a scenario currently allows for recovery to 1.3393 with secondary, a longer term 1.4513. This sort of thing is liable to become game changing for the future, taking Sterling into unfamiliar territory where a future surge to 1.71 becomes possible.
FUTURES
| Time Issued | Market | Price At Issue | Short Entry | Fast Exit | Slow Exit | Stop | Long Entry | Fast Exit | Slow Exit | Stop | Prior |
| 9:59:00PM | BRENT | 94.48 | Success | ||||||||
| 10:01:37PM | GOLD | 1874.73 | Success | ||||||||
| 10:05:03PM | FTSE | 7597.75 | |||||||||
| 10:06:47PM | STOX50 | 4145.8 | 4101 | 4087 | 4065 | 4131 | 4153 | 4170 | 4193 | 4120 | |
| 10:11:18PM | GERMANY | 15263 | 15205 | 15140 | 15083 | 15268 | 15303 | 15356 | 15431 | 15202 | ‘cess |
| 10:14:41PM | US500 | 4283.63 | Shambles | ||||||||
| 10:26:17PM | DOW | 33614 | ‘cess | ||||||||
| 10:28:57PM | NASDAQ | 14611.48 | |||||||||
| 10:31:46PM | JAPAN | 32309 | ‘cess |
27/09/2023 FTSE Closed at 7593 points. Change of -0.42%. Total value traded through LSE was: £ 5,367,119,674 a change of 0.5%
26/09/2023 FTSE Closed at 7625 points. Change of 0.01%. Total value traded through LSE was: £ 5,340,510,819 a change of -24.76%
25/09/2023 FTSE Closed at 7624 points. Change of -0.77%. Total value traded through LSE was: £ 7,097,867,582 a change of -9.65%
22/09/2023 FTSE Closed at 7683 points. Change of 0.07%. Total value traded through LSE was: £ 7,855,931,745 a change of 26.88%
21/09/2023 FTSE Closed at 7678 points. Change of -0.69%. Total value traded through LSE was: £ 6,191,643,124 a change of 28.33%
20/09/2023 FTSE Closed at 7731 points. Change of 0.93%. Total value traded through LSE was: £ 4,824,861,883 a change of -0.46%
19/09/2023 FTSE Closed at 7660 points. Change of 0.1%. Total value traded through LSE was: £ 4,847,212,890 a change of 23.66%
SUCCESS above means both FAST & SLOW targets were met. ‘CESS means just the FAST target met and probably the next time it is exceeded, movement to the SLOW target shall commence.
Our commentary is in two sections. Immediately below are today’s updated comments. If our commentary remains valid, the share can be found in the bottom section which has a RED heading. Hopefully, this will mean you no longer need to flip back through previous reports. HYPERLINKS DISABLED IN THIS VERSION
Please remember, all prices are mid-price (halfway between the Buy and Sell). When we refer to a price CLOSING above a specific level, we are viewing the point where we can regard a trend as changing. Otherwise, we are simply speculating on near term trading targets. Our website is www.trendsandtargets.com.
UPDATE. We often give an initial and a secondary price. If the initial is exceeded, we still expect it to fall back but the next time the initial is bettered, the price should continue to the secondary. The converse it true with price drops.
We can be contacted at info@trendsandtargets.com. Spam filters set to maximum so only legit emails get through…
Section One – Outlook Updated Today. Click here for Section Two – Outlook Remains Valid shares
Click Epic to jump to share: LSE:BP. BP PLC** **LSE:DGE Diageo** **LSE:ECO ECO (Atlantic) O & G** **LSE:EXPN Experian** **LSE:STAN Standard Chartered** **LSE:ZOO Zoo Digital** **
********
Updated charts published on : BP PLC, Diageo, ECO (Atlantic) O & G, Experian, Standard Chartered,
LSE:BP. BP PLC. Close Mid-Price: 538.5 Percentage Change: + 1.43% Day High: 538.7 Day Low: 530.6
Target met. Continued trades against BP. with a mid-price ABOVE 538.7 sho ……..
</p
View Previous BP PLC & Big Picture ***
LSE:DGE Diageo Close Mid-Price: 3022 Percentage Change: -1.52% Day High: 3067 Day Low: 3016.5
Target met. Weakness on Diageo below 3016.5 will invariably lead to 3002p ……..
</p
View Previous Diageo & Big Picture ***
LSE:ECO ECO (Atlantic) O & G Close Mid-Price: 11.75 Percentage Change: -4.08% Day High: 12.25 Day Low: 11.75
If ECO (Atlantic) O & G experiences continued weakness below 11.75, it wi ……..
</p
View Previous ECO (Atlantic) O & G & Big Picture ***
LSE:EXPN Experian Close Mid-Price: 2661 Percentage Change: -0.82% Day High: 2702 Day Low: 2661
If Experian experiences continued weakness below 2661, it will invariably ……..
</p
View Previous Experian & Big Picture ***
LSE:STAN Standard Chartered Close Mid-Price: 750.2 Percentage Change: -0.82% Day High: 764.8 Day Low: 748.6
In the event of Standard Chartered enjoying further trades beyond 764.8, ……..
</p
View Previous Standard Chartered & Big Picture ***
LSE:ZOO Zoo Digital Close Mid-Price: 52 Percentage Change: -4.59% Day High: 55.1 Day Low: 51.7
Continued weakness against ZOO taking the price below 51.7 calculates as ……..
</p
View Previous Zoo Digital & Big Picture ***