#Gold #WallSt If the claims are anything to go by, there’s something different going on with this maker of lithium batteries, especially as they threaten to turn the electric vehicle market on its head. Their first headline; “Charging to 80% of capacity in under 15 minutes!” should suffice to get peoples attention but when browsing the plethora of information and claims, the company could easily become a disruptive influence to the entire battery market.
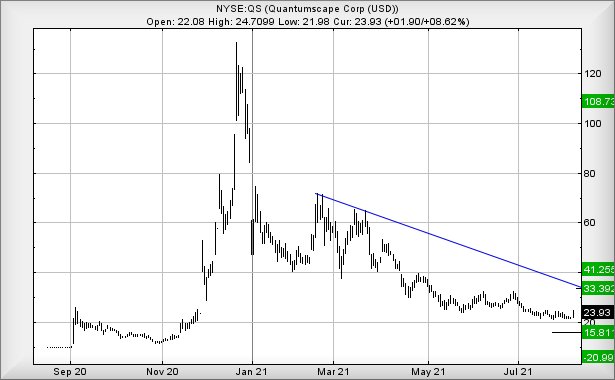
With VW already on board and claims of a sufficient funds to take their product to market, we really should not be surprised at receiving a bunch of emails asking us to cast an eye over the share price. The new battery is described as ‘Solid State’, fast charging, long lasting, non-combustible (quite a big deal) and capable of holding double the power of current premium lithium-ion batteries. It all sounds quite exciting which begs the question, why is a share which traded at $132 after its launch now languishing at just $24 US.
Obviously, there’s an often distasteful trajectory followed by share prices, following a launch and we’re inclined to view QuantumScape as no different from many, many, others. In fact, we’re a little surprised the share price has not yet enacted the critical second surge, the one which, if the price exceeds the post-launch high of US $132 will suggest the sky is the limit. This turn of phrase is liable to prove justified, if the claims of the new battery translate to real life. The current nonsense, promising flying taxi services in exotic locations, tends fall apart, due to battery power and life. However, if this companies product lives up to the blurb in their press releases, things could become quite interesting throughout all aspects of the electric vehicle market.
Of course, there is ointment and there is a fly.
The online tech magazine, “WIRED”, took a deeper review of the company claims and frankly, their article gushed praise on the product. Then opted to mention an important caveat.
All the test results were produced from individual lithium cells, rather than complete batteries. An actual battery will comprise of around 100 lithium cells, creating a battery the size of a cigarette packet. An electric vehicle will typically require several hundred on these finished batteries. At the time of WIRED’s article, the company had not yet tested a fully built battery. The company boss says, confidently, “It’s not a question of whether this will work or not. It’s just a question of engineering.”
The WIRED article finishes, mentioning a couple of companies which previous raised huge sums, promising game changing batteries. They crashed, when their performance failed to match expectations.
However, on the basis all this smoke must be fueled by fire, perhaps this shall indeed be an opportunity to get involved at the ground floor level for a new product. Perhaps some research shall be justified.
Near term, presently trading at $24, the price needs exceed $27.7 to suggest imminent share movement to an initial $33. If exceeded, our secondary works out at $41.25. In the grand scheme of things, neither ambition is particularly interesting but, should our secondary be exceeded, things are liable to improve quite fast. There is the potential of a heck of a jump toward $108, a level at which we’d anticipate some hesitation.
The share price needs below $15.8 to provoke real concern, thanks to our drop target being prefaced by a minus sign!
FUTURES
| Time Issued | Market | Price At Issue | Short Entry | Fast Exit | Slow Exit | Stop | Long Entry | Fast Exit | Slow Exit | Stop | Prior |
| 10:59:06PM | BRENT | 69.1 | Success | ||||||||
| 11:01:46PM | GOLD | 1730.04 | 1718 | 1708 | 1693 | 1740 | 1742 | 1759 | 1770 | 1726 | Success |
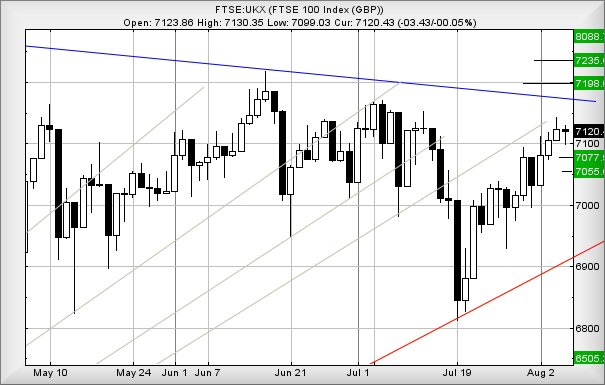
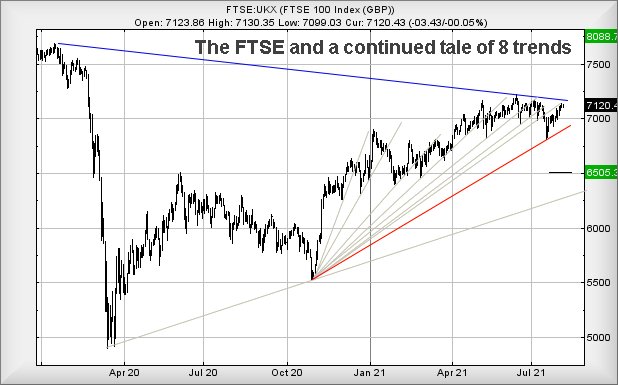
| 11:04:06PM | FTSE | 7140.59 | Shambles | ||||||||
| 11:05:54PM | FRANCE | 6821 | |||||||||
| 11:08:09PM | GERMANY | 15771.88 | Success | ||||||||
| 11:10:13PM | US500 | 4435.07 | 4421 | 4415.5 | 4408 | 4436 | 4438 | 4442 | 4450 | 4424 | |
| 11:12:06PM | DOW | 35124 | |||||||||
| 11:13:55PM | NASDAQ | 15138.19 | |||||||||
| 11:15:54PM | JAPAN | 27933 | Success |
9/08/2021 FTSE Closed at 7132 points. Change of 0.14%. Total value traded through LSE was: £ 4,952,268,424 a change of -14.01%
6/08/2021 FTSE Closed at 7122 points. Change of 0.03%. Total value traded through LSE was: £ 5,759,335,075 a change of 3.28%
5/08/2021 FTSE Closed at 7120 points. Change of -0.04%. Total value traded through LSE was: £ 5,576,456,686 a change of -7.06%
4/08/2021 FTSE Closed at 7123 points. Change of 0.25%. Total value traded through LSE was: £ 6,000,336,002 a change of 33.33%
3/08/2021 FTSE Closed at 7105 points. Change of 0.34%. Total value traded through LSE was: £ 4,500,441,860 a change of 3.51%
2/08/2021 FTSE Closed at 7081 points. Change of 0.7%. Total value traded through LSE was: £ 4,347,850,496 a change of -16.5%
30/07/2021 FTSE Closed at 7032 points. Change of -0.65%. Total value traded through LSE was: £ 5,206,905,420 a change of -14.32%
SUCCESS above means both FAST & SLOW targets were met. ‘CESS means just the FAST target met and probably the next time it is exceeded, movement to the SLOW target shall commence.
Our commentary is in two sections. Immediately below are today’s updated comments. If our commentary remains valid, the share can be found in the bottom section which has a RED heading. Hopefully, this will mean you no longer need to flip back through previous reports. HYPERLINKS DISABLED IN THIS VERSION
Please remember, all prices are mid-price (halfway between the Buy and Sell). When we refer to a price CLOSING above a specific level, we are viewing the point where we can regard a trend as changing. Otherwise, we are simply speculating on near term trading targets. Our website is www.trendsandtargets.com.
UPDATE. We often give an initial and a secondary price. If the initial is exceeded, we still expect it to fall back but the next time the initial is bettered, the price should continue to the secondary. The converse it true with price drops.
We can be contacted at info@trendsandtargets.com. Spam filters set to maximum so only legit emails get through…
Section One – Outlook Updated Today. Click here for Section Two – Outlook Remains Valid shares
Click Epic to jump to share: LSE:AV. Aviva** **LSE:BARC Barclays** **LSE:CEY Centamin** **LSE:CPI Capita** **LSE:DDDD 4D Pharma** **LSE:FGP Firstgroup** **LSE:HL. Hargreaves Lansdown** **LSE:IGAS Igas Energy** **LSE:MRW Morrisons** **LSE:NG. National Glib** **LSE:NWG Natwest** **LSE:OXIG Oxford Instruments** **LSE:POG Petrop etc** **LSE:POLY Polymetal** **LSE:PPC President Energy** **LSE:RMG Royal Mail** **LSE:SRP Serco** **LSE:VEC Vectura** **LSE:VOG VICTORIA** **
********
Updated charts published on : Aviva, Barclays, Centamin, Capita, 4D Pharma, Firstgroup, Hargreaves Lansdown, Igas Energy, Morrisons, National Glib, Natwest, Oxford Instruments, Petrop etc, Polymetal, President Energy, Royal Mail, Serco, Vectura, VICTORIA,
LSE:AV. Aviva. Close Mid-Price: 400.3 Percentage Change: + 0.30% Day High: 401.5 Day Low: 396.9
Continued trades against AV. with a mid-price ABOVE 401.5 should improve ……..
</p
View Previous Aviva & Big Picture ***
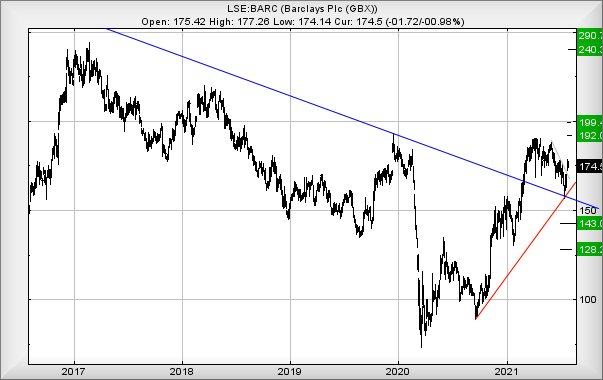
LSE:BARC Barclays. Close Mid-Price: 184.38 Percentage Change: + 0.94% Day High: 184.82 Day Low: 182.16
Further movement against Barclays ABOVE 184.82 should improve acceleratio ……..
</p
View Previous Barclays & Big Picture ***
LSE:CEY Centamin Close Mid-Price: 97.66 Percentage Change: -3.69% Day High: 101.3 Day Low: 97.94
Weakness on Centamin below 97.94 will invariably lead to 90p but importan ……..
</p
View Previous Centamin & Big Picture ***
LSE:CPI Capita. Close Mid-Price: 43 Percentage Change: + 7.34% Day High: 43.4 Day Low: 39.11
All Capita needs are mid-price trades ABOVE 43.4 to improve acceleration ……..
</p
View Previous Capita & Big Picture ***
LSE:DDDD 4D Pharma. Close Mid-Price: 82.6 Percentage Change: + 0.98% Day High: 83.2 Day Low: 80.2
Target met. Weakness on 4D Pharma below 80.2 will invariably lead to 78 w ……..
</p
View Previous 4D Pharma & Big Picture ***
LSE:FGP Firstgroup. Close Mid-Price: 91.3 Percentage Change: + 1.39% Day High: 91.6 Day Low: 89.2
All Firstgroup needs are mid-price trades ABOVE 91.6 to improve accelerat ……..
</p
View Previous Firstgroup & Big Picture ***
LSE:HL. Hargreaves Lansdown Close Mid-Price: 1454.5 Percentage Change: -11.34% Day High: 1541.5 Day Low: 1431
Target met. In the event Hargreaves Lansdown experiences weakness below 1 ……..
</p
View Previous Hargreaves Lansdown & Big Picture ***
LSE:IGAS Igas Energy Close Mid-Price: 15.5 Percentage Change: -4.02% Day High: 15.05 Day Low: 15.05
If Igas Energy experiences continued weakness below 15.05, it will invari ……..
</p
View Previous Igas Energy & Big Picture ***
LSE:MRW Morrisons. Close Mid-Price: 278.8 Percentage Change: + 0.00% Day High: 281.9 Day Low: 278
Continued trades against MRW with a mid-price ABOVE 281.9 should improve ……..
</p
View Previous Morrisons & Big Picture ***
LSE:NG. National Glib. Close Mid-Price: 945.1 Percentage Change: + 0.39% Day High: 948.3 Day Low: 940
Further movement against National Glib ABOVE 948.3 should improve acceler ……..
</p
View Previous National Glib & Big Picture ***
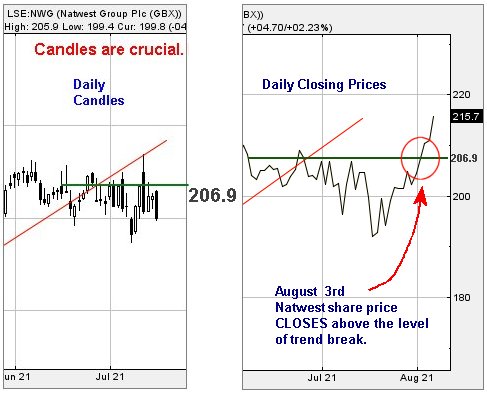
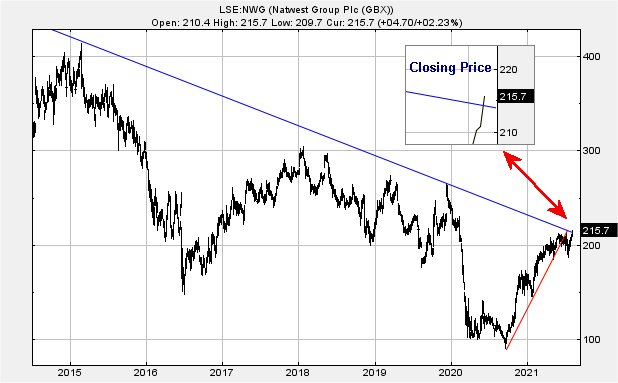
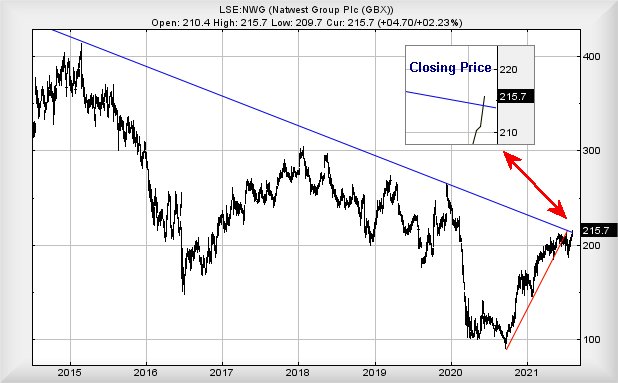
LSE:NWG Natwest. Close Mid-Price: 217 Percentage Change: + 0.60% Day High: 217.6 Day Low: 213.9
All Natwest needs are mid-price trades ABOVE 217.6 to improve acceleratio ……..
</p
View Previous Natwest & Big Picture ***
LSE:OXIG Oxford Instruments Close Mid-Price: 2485 Percentage Change: -2.55% Day High: 2620 Day Low: 2525
All Oxford Instruments needs are mid-price trades ABOVE 2620 to improve a ……..
</p
View Previous Oxford Instruments & Big Picture ***
LSE:POG Petrop etc Close Mid-Price: 19.82 Percentage Change: -3.22% Day High: 20.5 Day Low: 19.75
Target met. Weakness on Petrop etc below 19.75 will invariably lead to 18 ……..
</p
View Previous Petrop etc & Big Picture ***
LSE:POLY Polymetal Close Mid-Price: 1482.5 Percentage Change: -1.95% Day High: 1510 Day Low: 1482.5
In the event Polymetal experiences weakness below 1482.5 it calculates wi ……..
</p
View Previous Polymetal & Big Picture ***
LSE:PPC President Energy Close Mid-Price: 1.75 Percentage Change: -5.41% Day High: 1.85 Day Low: 1.66
Target met. Weakness on President Energy below 1.66 will invariably lead ……..
</p
View Previous President Energy & Big Picture ***
LSE:RMG Royal Mail Close Mid-Price: 493 Percentage Change: -1.04% Day High: 499.7 Day Low: 488.4
Weakness on Royal Mail below 488.4 will invariably lead to 486 with secon ……..
</p
View Previous Royal Mail & Big Picture ***
LSE:SRP Serco Close Mid-Price: 139 Percentage Change: -0.29% Day High: 139.6 Day Low: 136.4
Continued weakness against SRP taking the price below 136.4 calculates as ……..
</p
View Previous Serco & Big Picture ***
LSE:VEC Vectura. Close Mid-Price: 173 Percentage Change: + 5.49% Day High: 173.2 Day Low: 167.4
Target met. All Vectura needs are mid-price trades ABOVE 173.2 to improve ……..
</p
View Previous Vectura & Big Picture ***
LSE:VOG VICTORIA. Close Mid-Price: 3.85 Percentage Change: + 2.67% Day High: 3.75 Day Low: 3.5
Target met. If VICTORIA experiences continued weakness below 3.5, it will ……..
</p
View Previous VICTORIA & Big Picture ***