#FreeFutures #FTSE #Gold It’s been a tough week, due to a bereavement, but thankfully with a couple of lighter moments. In fact, in some ways remarkably similar to the moods exhibited by the FTSE. Hysterical hilarity was provided, due to failing to recognise the difference between my wife or daughter’s voice in a phone call. With my wife’s mother passing away in hospital on the mainland, one of the daughters, notoriously tight fisted, was grumbling at the costs involved in returning her mothers body ‘across the water in Argyll’ for the funeral.
When my phone rang, mistaking my daughters voice for my wife created a dreadful mental image. I thought I heard my wife say, “Lucy is on the ferry with Mum and they’re coming over as passengers!” An immediate vision of the penny pinching woman, somehow getting her mothers body into a wheelchair and pushing it onto the ferry was, for a brief time, quite believable.
My daughter heard the impending explosion in my loud “she has what?”, quickly saying, “It’s me, Jax. I just dropped Lucy and Mum at the ferry terminal”
Once I realised it was my wife and sister on the ferry, a giggle turned into uncontrolled laughter, the story resonating through the family for the rest of the day. I secretly suspect ‘Lucy’ is annoyed for not having thought of the idea.
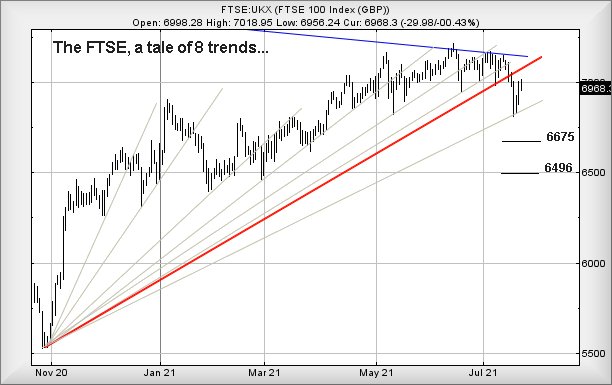
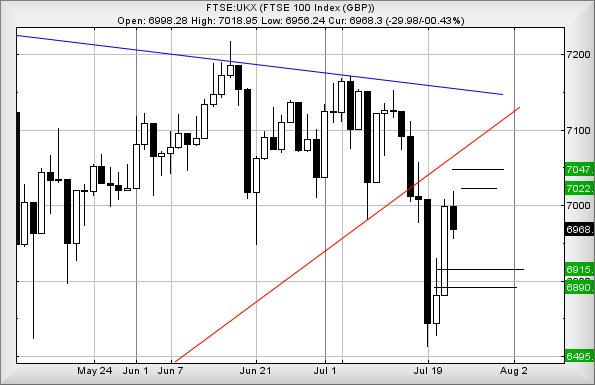
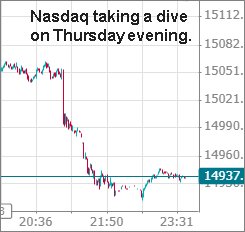
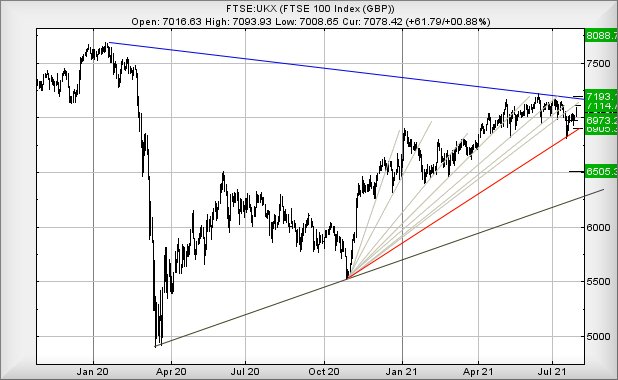
Similarly, the FTSE has spent this week, threatening the worst but finally, on Thursday, it started to make some sense as the market exceeded the weeks high of 7038 points and more importantly, closed the session above 7027 points, thus exceeding the point of trend break for Uptrend #7 and giving hope for the future. From our usual perspective, this is liable to be quite a big deal, were it not for moves internationally against the index’ during Thursday evening. Some fairly sharp reversals have taken place but curiously, Wall St has failed follow the Nasdaq and S&P 500 over a cliff.
We wonder if the reversals were just nerves from traders, worried at the markets starting to overheat. If this is the case, time will tell. The FTSE needs below 6900 points before hysteria is justified, the market once again risking reversal to 6500 in such a scenario.
Instead, it appears above 7098 points should make a fairly modest attempt at 7114 points near term. If exceeded, our secondary works out at a longer term 7193 points and this is liable to prove a big deal for the longer term. Unfortunately, if this triggers, the stop needs be wide around 7008 points, thanks to the markets showing aggressive movements in attempts to slow down gains.
The alternate scenario, if the FTSE wanders below 7009 points, calculates with a drop potential toward an initial 6973 points. If broken, our secondary works out at 6905 points, dangerously close to causing real trouble for the market.
Finally, we referred to 7193 above as a Big Deal for the longer term. Achieving such a level, while making it almost certain London intends challenge the pre-Covid level of 7550 points, also places the FTSE in a position where 8088 shall be viewed as the ruling big picture influence.
Yet again, our sincere thanks to the kind folk who find adverts by Google on this page worthy of a visit.
FUTURES
| Time Issued | Market | Price At Issue | Short Entry | Fast Exit | Slow Exit | Stop | Long Entry | Fast Exit | Slow Exit | Stop | Prior |
| 9:54:25PM | BRENT | 74.9 | 73.97 | 73.485 | 74.67 | 75.15 | 75.545 | 73.97 | ‘cess | ||
| 9:56:44PM | GOLD | 1828.02 | 1821 | 1818 | 1828 | 1833 | 1838 | 1823 | Success | ||
| 9:58:28PM | FTSE | 7045.88 | 7027 | 7002 | 7074 | 7090 | 7097 | 7005 | ‘cess | ||
| 10:00:21PM | FRANCE | 6622.5 | 6613 | 6598 | 6654 | 6670 | 6732 | 6613 | Success | ||
| 10:02:28PM | GERMANY | 15575 | 15520 | 15497 | 15614 | 15638 | 15669 | 15548 | ‘cess | ||
| 10:09:01PM | US500 | 4405 | 4393 | 4388 | 4423 | 4430 | 4437 | 4400 | ‘cess | ||
| 10:24:21PM | DOW | 35106 | 34879 | 34792 | 35055 | 35164 | 35239 | 35049 | |||
| 10:28:34PM | NASDAQ | 14930 | 14914 | 14876.5 | 14999 | 15006 | 15028.5 | 14968 | Shambles | ||
| 10:36:54PM | JAPAN | 27757 | 27627 | 27572 | 27824 | 27938 | 28025 | 27694 |
29/07/2021 FTSE Closed at 7078 points. Change of 0.88%. Total value traded through LSE was: £ 6,077,251,516 a change of 24.02%
28/07/2021 FTSE Closed at 7016 points. Change of 0.29%. Total value traded through LSE was: £ 4,900,403,964 a change of 0.43%
27/07/2021 FTSE Closed at 6996 points. Change of -0.41%. Total value traded through LSE was: £ 4,879,437,530 a change of 9.03%
26/07/2021 FTSE Closed at 7025 points. Change of -0.03%. Total value traded through LSE was: £ 4,475,417,848 a change of 19.69%
23/07/2021 FTSE Closed at 7027 points. Change of 0.85%. Total value traded through LSE was: £ 3,739,108,834 a change of -21.27%
22/07/2021 FTSE Closed at 6968 points. Change of -0.43%. Total value traded through LSE was: £ 4,748,992,590 a change of -28.77%
21/07/2021 FTSE Closed at 6998 points. Change of 1.7%. Total value traded through LSE was: £ 6,667,496,815 a change of 20.91%
SUCCESS above means both FAST & SLOW targets were met. ‘CESS means just the FAST target met and probably the next time it is exceeded, movement to the SLOW target shall commence.
Our commentary is in two sections. Immediately below are today’s updated comments. If our commentary remains valid, the share can be found in the bottom section which has a RED heading. Hopefully, this will mean you no longer need to flip back through previous reports. HYPERLINKS DISABLED IN THIS VERSION
Please remember, all prices are mid-price (halfway between the Buy and Sell). When we refer to a price CLOSING above a specific level, we are viewing the point where we can regard a trend as changing. Otherwise, we are simply speculating on near term trading targets. Our website is www.trendsandtargets.com.
UPDATE. We often give an initial and a secondary price. If the initial is exceeded, we still expect it to fall back but the next time the initial is bettered, the price should continue to the secondary. The converse it true with price drops.
We can be contacted at info@trendsandtargets.com. Spam filters set to maximum so only legit emails get through…
Section One – Outlook Updated Today. Click here for Section Two – Outlook Remains Valid shares
Click Epic to jump to share: LSE:BT.A British Telecom** **LSE:CNA Centrica** **LSE:DGE Diageo** **LSE:EXPN Experian** **LSE:FRES Fresnillo** **LSE:GLEN Glencore Xstra** **LSE:OXIG Oxford Instruments** **LSE:POLY Polymetal** **LSE:RMG Royal Mail** **LSE:RR. Rolls Royce** **
********
Updated charts published on : British Telecom, Centrica, Diageo, Experian, Fresnillo, Glencore Xstra, Oxford Instruments, Polymetal, Royal Mail, Rolls Royce,
LSE:BT.A British Telecom Close Mid-Price: 171.9 Percentage Change: -6.55% Day High: 178.55 Day Low: 167.4
Target met. If British Telecom experiences continued weakness below 167.4 ……..
</p
View Previous British Telecom & Big Picture ***
LSE:CNA Centrica Close Mid-Price: 46.48 Percentage Change: -2.04% Day High: 47.64 Day Low: 46.62
Weakness on Centrica below 46.62 will invariably lead to 43.7 with second ……..
</p
View Previous Centrica & Big Picture ***
LSE:DGE Diageo. Close Mid-Price: 3540 Percentage Change: + 0.77% Day High: 3607 Day Low: 3397
Target met. Continued trades against DGE with a mid-price ABOVE 3607 shou ……..
</p
View Previous Diageo & Big Picture ***
LSE:EXPN Experian. Close Mid-Price: 3170 Percentage Change: + 1.54% Day High: 3180 Day Low: 3116
Further movement against Experian ABOVE 3180 should improve acceleration ……..
</p
View Previous Experian & Big Picture ***
LSE:FRES Fresnillo. Close Mid-Price: 820.6 Percentage Change: + 1.76% Day High: 833.4 Day Low: 815.2
In the event of Fresnillo enjoying further trades beyond 833.4, the share ……..
</p
View Previous Fresnillo & Big Picture ***
LSE:GLEN Glencore Xstra. Close Mid-Price: 329.45 Percentage Change: + 0.76% Day High: 333.1 Day Low: 327.8
All Glencore Xstra needs are mid-price trades ABOVE 333.1 to improve acce ……..
</p
View Previous Glencore Xstra & Big Picture ***
LSE:OXIG Oxford Instruments. Close Mid-Price: 2490 Percentage Change: + 2.26% Day High: 2550 Day Low: 2425
Further movement against Oxford Instruments ABOVE 2550 should improve acc ……..
</p
View Previous Oxford Instruments & Big Picture ***
LSE:POLY Polymetal. Close Mid-Price: 1557.5 Percentage Change: + 1.47% Day High: 1580 Day Low: 1547.5
Target met. All Polymetal needs are mid-price trades ABOVE 1580 to improv ……..
</p
View Previous Polymetal & Big Picture ***
LSE:RMG Royal Mail Close Mid-Price: 508 Percentage Change: -3.13% Day High: 517.6 Day Low: 501.8
Continued weakness against RMG taking the price below 501.8 calculates as ……..
</p
View Previous Royal Mail & Big Picture ***
LSE:RR. Rolls Royce. Close Mid-Price: 102.18 Percentage Change: + 0.47% Day High: 104.4 Day Low: 101.6
Further movement against Rolls Royce ABOVE 104.4 should improve accelerati ……..
</p
View Previous Rolls Royce & Big Picture ***