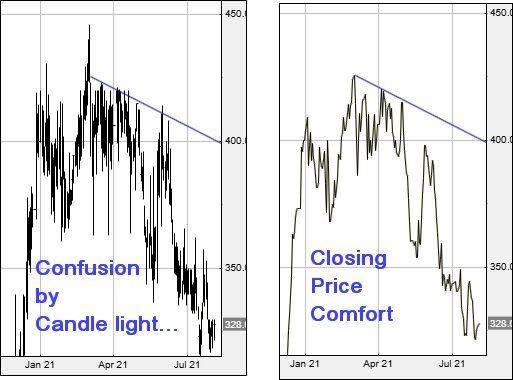
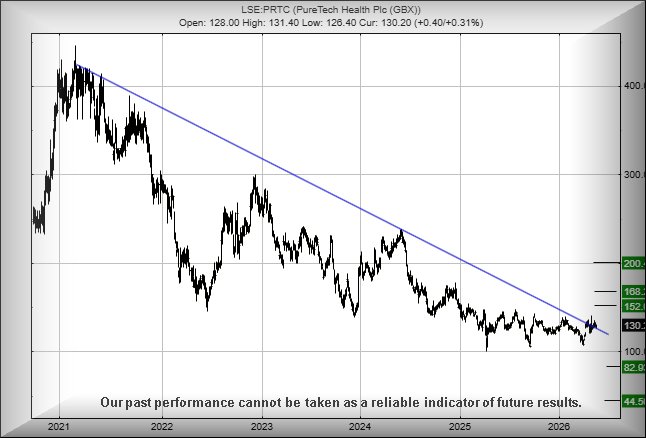
#GOLD #GERMANY Sometimes we switch to analysis purely by closing price, due to the stock market playing games with crazy intraday pricing. PureTech were victims of this sort of game back in 2021 when from January through to June, the share price suffered bonkers intraday swings, yet the closing prices managed to define a new downtrend. With our usual lack of imagination, it’s the Blue line on the chart where despite the series of mad intraday swings, the market somehow contrived to produce what looks like a planned downtrend. If this is indeed the case, perhaps things are about to become interesting for the share, especially as we’ve received a few emails asking our opinion.
The two chart extracts below highlight, quite nastily, an occasion when intraday candles have the capability of producing a completely wrong trend, one which can be ignored. Instead, a cunning plan was gestating, one which involved the closing price each day.
The sort of nonsense above isn’t coincidence. We routinely check trend lines, just to confirm if a share is being mapped by the (usually accurate) High of The Day or the (very important) Day Closing price. Should this indeed be the case, PureTech is being presented as a share where either Closure above 136p or intraday traffic above 143p shall be important, hopefully triggering share price recovery to an initial confident 152p with our secondary, if bettered, a longer term 166p. This secondary is quite a big deal, exposing the share price to a lure at 200p and beyond?
The fly in the ointment comes, if the price closes below just 128p as this would utterly foul up our calculations, creating an unpleasant situation where weakness to 82 becomes possible with our secondary, if broken, an ultimate bottom of just 44p, a level before which we’d anticipate a real bounce.
However, the biotechnology company are “real”, doing the research and producing successful drugs. On this alone, we lean toward optimism for the future though, above 200p will require we take a good hard look at the tea leaves.
FUTURES
FUTURES
| Time Issued | Market | Price At Issue | Short Entry | Fast Exit | Slow Exit | Stop | Long Entry | Fast Exit | Slow Exit | Stop | Prior |
| 11:23:10PM | BRENT | 10132 | |||||||||
| 11:26:38PM | GOLD | 4536.39 | 4467 | 4446 | 4411 | 4516 | 4552 | 4577 | 4618 | 4522 | |
| 11:30:45PM | FTSE | 10405 | ‘cess | ||||||||
| 11:35:47PM | STOX50 | 5962.3 | ‘cess | ||||||||
| 11:38:37PM | GERMANY | 24691.5 | 24439 | 24280 | 24078 | 24598 | 24793 | 24907 | 25157 | 24694 | |
| 11:44:00PM | US500 | 7399.2 | Success | ||||||||
| 11:46:53PM | DOW | 49884 | Success | ||||||||
| 11:50:45PM | NASDAQ | 29113.6 | ‘cess | ||||||||
| 11:53:08PM | JAPAN | 61243 | ‘cess |

SUCCESS above means both FAST & SLOW targets were met. ‘CESS means just the FAST target met and probably the next time it is exceeded, movement to the SLOW target shall commence.
Our commentary is in two sections. Immediately below are today’s updated comments. If our commentary remains valid, the share can be found in the bottom section which has a RED heading. Hopefully, this will mean you no longer need to flip back through previous reports. HYPERLINKS DISABLED IN THIS VERSION
Please remember, all prices are mid-price (halfway between the Buy and Sell). When we refer to a price CLOSING above a specific level, we are viewing the point where we can regard a trend as changing. Otherwise, we are simply speculating on near term trading targets. Our website is www.trendsandtargets.com.
UPDATE. We often give an initial and a secondary price. If the initial is exceeded, we still expect it to fall back but the next time the initial is bettered, the price should continue to the secondary. The converse it true with price drops.
We can be contacted at info@trendsandtargets.com. Spam filters set to maximum so only legit emails get through…
Section One – Outlook Updated Today. Click here for Section Two – Outlook Remains Valid shares
Click Epic to jump to share: LSE:CPI Capita** **LSE:EMG MAN** **LSE:IGG IG Group** **LSE:TSCO Tesco** **
********
Updated charts published on : Capita, MAN, IG Group, Tesco,
LSE:CPI Capita. Close Mid-Price: 374 Percentage Change: + 0.00% Day High: 0 Day Low: 0
Target met. Continued trades against CPI with a mid-price ABOVE 374p shou ……..
</p
View Previous Capita & Big Picture ***
LSE:EMG MAN. Close Mid-Price: 283.4 Percentage Change: + 0.00% Day High: 0 Day Low: 0
Target met. Continued trades against EMG with a mid-price ABOVE 288p shou ……..
</p
View Previous MAN & Big Picture ***
LSE:IGG IG Group. Close Mid-Price: 1805 Percentage Change: + 0.00% Day High: 0 Day Low: 0
Target met. Further movement against IG Group ABOVE 1805 should improve a ……..
</p
View Previous IG Group & Big Picture ***
LSE:TSCO Tesco. Close Mid-Price: 460.2 Percentage Change: + 0.00% Day High: 0 Day Low: 0
Below 442 now threatens reversal to an initial 411p with our secondary, if ……..
</p
View Previous Tesco & Big Picture ***