#Brent #Gold
Every now and then, we gleefully jump at the chance to ridicule chart patterns, often a part of a core belief structure for some traders. In fact, if were were to create a Top 3 of things which do not work for analysis, Moving Averages is #1, Candlestick patterns is #2 with Chart Patterns tying for position at #2. To be blunt, most technical indicators are a complete waste of space unless the trader understands how to “tune” an indicator against historical price behaviour for any specified item.
Unfortunately, in most internet chatrooms, folks will enthuse about what ‘MacD’ points toward, completely unaware the default set of averages supplied for a ‘MacD’ shall be completely wrong unless, by some miracle, they’re discussing a share at the market average price, historically making completely average movements. When you pause to consider this, it should be quickly realised the average share simply doesn’t exist. However…
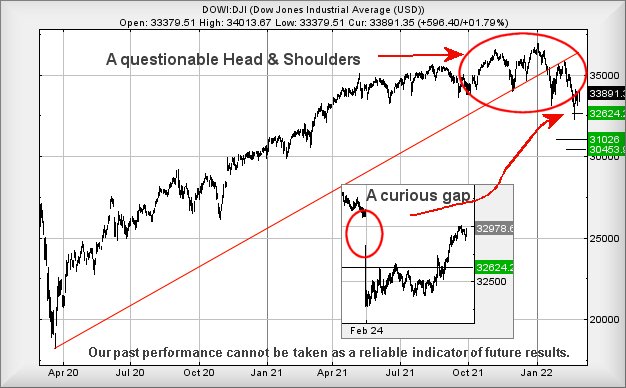
We’ve often a problem with Tom Bulkowski’s Head & Shoulders chart pattern, ‘cos it sometimes works. Basically the pattern breaks down into a series of emotions, especially against something turbulent.
- We’ve all confident, it’s going up.
- Okay, that’s far enough. I’m taking profit and bailing. The price drops.
- Hey, that share had dropped sharply. Think I’ll jump in.
- Look, we’ve just passed the previous high. I’m out of here. The price drops.
- Hey, that share had dropped sharply. Think I’ll jump in.
- Feels like it’s struggling to match the first high price. I’m nervous and getting out. The price drops.
- Look at that share. It can’t even reach the level of previous highs. I’m not touching it. The price drops further.
This trading cycle combines to produce the classic Head & Shoulder pattern and when you combine the emotions with the roller coaster, everything starts to make a grudging sense. Unfortunately, when looking at Wall St currently, the index is setting itself up for a bit of a Head & Shoulders moment and we worry about how far the dandruff risks dropping. Our own take on the situation was given in January (link here) when we supplied criteria for reversal from 34,525 to 32,624 points, a drop of 1,901 points. This movement completed at the end of February and crucially, the index failed to close the session below our target level. As a result – from our perspective – the final nail remains absent from the Head & Shoulders coffin which is lurking against the DOW JONES.
The immediate situation (Wall St trading around 33,880 at time of writing) demands the index weaken below 33,090 to enter a cycle which threatens reversal to an initial 31,026 points. Our secondary is relatively close by, lurking at 30,453 and creating a suggestion of a bounce, should such a level appear. Even visually, this would make some sense. To cancel our gloomy outlook, Wall St requires trade above 34,885 points currently.
Finally, something quite curious occurred the day the market hit and broke our 32,624 target level. We’ve shown it on the chart inset but basically, the only reason our target level broke was thanks to Wall Street being “gapped down” at the open on the 24th February. Go figure!
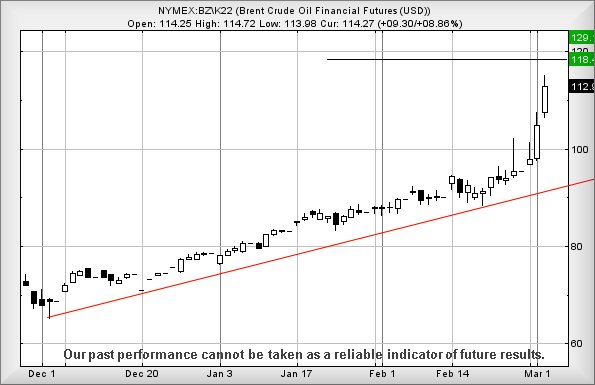
As for Brent Crude, we’ll keep it short and sharp, thanks to the inspired essay above!
The oil market has been showing some impressive high prices and it appears they are close to running out of steam. For Brent Crude, now above $114.80 looks capable of attempting an initial $118.4 next. Should this level be exceeded, our secondary calculation works out at $129.1 and we expect some volatility at such a level. To be blunt, it seems now isn’t the time to rush and open a short as there’s the potential of further growth for the black stuff. Personally, I’m growing to hate folk with electric cars, thanks to the litre price at our local garage of 153p!
FUTURES
| Time Issued | Market | Price At Issue | Short Entry | Fast Exit | Slow Exit | Stop | Long Entry | Fast Exit | Slow Exit | Stop | Prior |
| 9:45:58PM | BRENT | 113.95 | 106.9 | 105.6 | 102.5 | 110.8 | 114.8 | 117.1 | 120.5 | 108.7 | Success |
| 9:48:19PM | GOLD | 1925.52 | 1910 | 1896 | 1878 | 1935 | 1948 | 1955 | 1969 | 1928 | |
| 9:50:47PM | FTSE | 7411.02 | 7400 | Success | |||||||
| 9:55:44PM | FRANCE | 6490 | 6449 | ||||||||
| 9:57:54PM | GERMANY | 13988 | 13900 | Shambles | |||||||
| 10:03:29PM | US500 | 4378 | 4308 | Success | |||||||
| 10:07:17PM | DOW | 33835 | 33620 | Success | |||||||
| 10:13:45PM | NASDAQ | 14195 | 14093 | ||||||||
| 10:17:39PM | JAPAN | 26659 | 26475 | ‘cess |
2/03/2022 FTSE Closed at 7429 points. Change of 1.35%. Total value traded through LSE was: £ 8,074,541,610 a change of -5.31%
1/03/2022 FTSE Closed at 7330 points. Change of -1.72%. Total value traded through LSE was: £ 8,527,347,509 a change of -15.97%
28/02/2022 FTSE Closed at 7458 points. Change of -0.41%. Total value traded through LSE was: £ 10,147,661,297 a change of 20.2%
25/02/2022 FTSE Closed at 7489 points. Change of 3.91%. Total value traded through LSE was: £ 8,442,124,681 a change of -14.64%
24/02/2022 FTSE Closed at 7207 points. Change of -3.88%. Total value traded through LSE was: £ 9,889,574,342 a change of 64.76%
23/02/2022 FTSE Closed at 7498 points. Change of 0.05%. Total value traded through LSE was: £ 6,002,308,781 a change of -10.52%
22/02/2022 FTSE Closed at 7494 points. Change of 0.13%. Total value traded through LSE was: £ 6,707,697,679 a change of 29%
SUCCESS above means both FAST & SLOW targets were met. ‘CESS means just the FAST target met and probably the next time it is exceeded, movement to the SLOW target shall commence.
Our commentary is in two sections. Immediately below are today’s updated comments. If our commentary remains valid, the share can be found in the bottom section which has a RED heading. Hopefully, this will mean you no longer need to flip back through previous reports. HYPERLINKS DISABLED IN THIS VERSION
Please remember, all prices are mid-price (halfway between the Buy and Sell). When we refer to a price CLOSING above a specific level, we are viewing the point where we can regard a trend as changing. Otherwise, we are simply speculating on near term trading targets. Our website is www.trendsandtargets.com.
UPDATE. We often give an initial and a secondary price. If the initial is exceeded, we still expect it to fall back but the next time the initial is bettered, the price should continue to the secondary. The converse it true with price drops.
We can be contacted at info@trendsandtargets.com. Spam filters set to maximum so only legit emails get through…
Section One – Outlook Updated Today. Click here for Section Two – Outlook Remains Valid shares
Click Epic to jump to share: LSE:BARC Barclays** **LSE:CAR Carclo** **LSE:CEY Centamin** **LSE:CPI Capita** **LSE:DARK Darktrace Plc** **LSE:EXPN Experian** **LSE:FGP Firstgroup** **LSE:GLEN Glencore Xstra** **LSE:IAG British Airways** **LSE:LLOY Lloyds Grp.** **LSE:MKS Marks and Spencer** **LSE:NWG Natwest** **LSE:OPG OPG Power Ventures** **LSE:POG Petrop etc** **LSE:POLY Polymetal** **LSE:RBD Reabold Resources PLC** **LSE:RMG Royal Mail** **LSE:RR. Rolls Royce** **LSE:SBRY Sainsbury** **LSE:TRN The Trainline** **LSE:ZOO Zoo Digital** **
********
Updated charts published on : Barclays, Carclo, Centamin, Capita, Darktrace Plc, Experian, Firstgroup, Glencore Xstra, British Airways, Lloyds Grp., Marks and Spencer, Natwest, OPG Power Ventures, Petrop etc, Polymetal, Reabold Resources PLC, Royal Mail, Rolls Royce, Sainsbury, The Trainline, Zoo Digital,
LSE:BARC Barclays. Close Mid-Price: 176.96 Percentage Change: + 2.16% Day High: 178.56 Day Low: 170.1
Ongoing trouble below 170 still points at the potential of reversal to an ……..
</p
View Previous Barclays & Big Picture ***
LSE:CAR Carclo Close Mid-Price: 28.4 Percentage Change: -5.02% Day High: 29 Day Low: 27
In the event Carclo experiences weakness below 27, it now calculates with ……..
</p
View Previous Carclo & Big Picture ***
LSE:CEY Centamin Close Mid-Price: 103.65 Percentage Change: -0.19% Day High: 108.3 Day Low: 103.85
This is now almost interesting as above 109 allows for an initial 113.5 ne ……..
</p
View Previous Centamin & Big Picture ***
LSE:CPI Capita Close Mid-Price: 26.23 Percentage Change: -0.68% Day High: 27.25 Day Low: 25.87
Target Met. Movement now below 25.75 threatens reversal to an initial 24 a ……..
</p
View Previous Capita & Big Picture ***
LSE:DARK Darktrace Plc. Close Mid-Price: 460 Percentage Change: + 0.22% Day High: 492.8 Day Low: 456.6
Above 493 still should promote recovery to an initial 517 with secondary, ……..
</p
View Previous Darktrace Plc & Big Picture ***
LSE:EXPN Experian. Close Mid-Price: 2983 Percentage Change: + 2.58% Day High: 3012 Day Low: 2883
Slightly useful, above 3012 now calculates with the potential of an initia ……..
</p
View Previous Experian & Big Picture ***
LSE:FGP Firstgroup. Close Mid-Price: 98.1 Percentage Change: + 0.72% Day High: 101 Day Low: 95.25
Weakness on Firstgroup below 95 will invariably lead to 90 as an initial d ……..
</p
View Previous Firstgroup & Big Picture ***
LSE:GLEN Glencore Xstra. Close Mid-Price: 452.6 Percentage Change: + 1.72% Day High: 459.15 Day Low: 449.6
Now above 459.2 should still signal 461 as the next major point of intere ……..
</p
View Previous Glencore Xstra & Big Picture ***
LSE:IAG British Airways. Close Mid-Price: 141.78 Percentage Change: + 4.19% Day High: 142.22 Day Low: 131.26
IAG remains messy as below 131 still suggests imminent weakness to an ini ……..
</p
View Previous British Airways & Big Picture ***
LSE:LLOY Lloyds Grp.. Close Mid-Price: 46.08 Percentage Change: + 0.64% Day High: 46.58 Day Low: 45.26
Weakness on Lloyds Grp. below 45 will invariably lead to 43.1 with seconda ……..
</p
View Previous Lloyds Grp. & Big Picture ***
LSE:MKS Marks and Spencer Close Mid-Price: 165.95 Percentage Change: -2.35% Day High: 170.6 Day Low: 163.05
Weakness on Marks and Spencer below 163 will invariably lead to 154 with s ……..
</p
View Previous Marks and Spencer & Big Picture ***
LSE:NWG Natwest. Close Mid-Price: 220 Percentage Change: + 1.62% Day High: 220.8 Day Low: 213.5
Now below 213 strongly suggests imminent reversal now to an initial 201 wi ……..
</p
View Previous Natwest & Big Picture ***
LSE:OPG OPG Power Ventures Close Mid-Price: 7.9 Percentage Change: -9.71% Day High: 8.75 Day Low: 7.75
Target Met. This is exceptionally bad as below 7.75 now calculates with th ……..
</p
View Previous OPG Power Ventures & Big Picture ***
LSE:POG Petrop etc Close Mid-Price: 2 Percentage Change: -59.76% Day High: 5.66 Day Low: 2.2
The situation now is of movement below 2p threatening 0.5p and that’s it. ……..
</p
View Previous Petrop etc & Big Picture ***
LSE:POLY Polymetal. Close Mid-Price: 306.9 Percentage Change: + 18.54% Day High: 319.9 Day Low: 234.2
In the event Polymetal experiences weakness below 234 it calculates with a ……..
</p
View Previous Polymetal & Big Picture ***
LSE:RBD Reabold Resources PLC. Close Mid-Price: 0.38 Percentage Change: + 14.93% Day High: 0.4 Day Low: 0.34
In the event of Reabold Resources PLC enjoying further trades beyond 0.40, ……..
</p
View Previous Reabold Resources PLC & Big Picture ***
LSE:RMG Royal Mail Close Mid-Price: 359 Percentage Change: -7.43% Day High: 383.7 Day Low: 356
Continued weakness against RMG taking the price below 356 calculates as le ……..
</p
View Previous Royal Mail & Big Picture ***
LSE:RR. Rolls Royce. Close Mid-Price: 98.23 Percentage Change: + 6.77% Day High: 98.61 Day Low: 87.02
Target Met. Thankfully it did not close the day below our secondary! Near ……..
</p
View Previous Rolls Royce & Big Picture ***
LSE:SBRY Sainsbury Close Mid-Price: 260 Percentage Change: -2.40% Day High: 270.6 Day Low: 258.7
Target Met. Weakness on Sainsbury below 258 will invariably lead to 251 wi ……..
</p
View Previous Sainsbury & Big Picture ***
LSE:TRN The Trainline. Close Mid-Price: 192.1 Percentage Change: + 4.23% Day High: 196.1 Day Low: 180.3
In the event The Trainline experiences weakness below 180, it calculates w ……..
</p
View Previous The Trainline & Big Picture ***
LSE:ZOO Zoo Digital Close Mid-Price: 111 Percentage Change: -5.53% Day High: 117.5 Day Low: 111
Target Met. Now below 111 is a problem, calculating with nasty reduction p ……..
</p
View Previous Zoo Digital & Big Picture ***