#Gold #Cac40 Animal behaviour cannot be predicted. One of our two ‘unwanted cats’ marched through the open office door, returning a moment later followed by our younger Golden Retriever. The cat made itself comfortable while the dog continued outside. Suddenly all hell broke loose when the dog “discovered” a very large black cat hiding at the wood shed. Once the inevitable noisy chase concluded, the dog proudly returned and the unwanted cat sauntered out to the garden.
There was no doubt the cat had employed the dog to chase an invader. But who could predict our ‘unwanted cats’ formed a co-operative pack with the dogs.
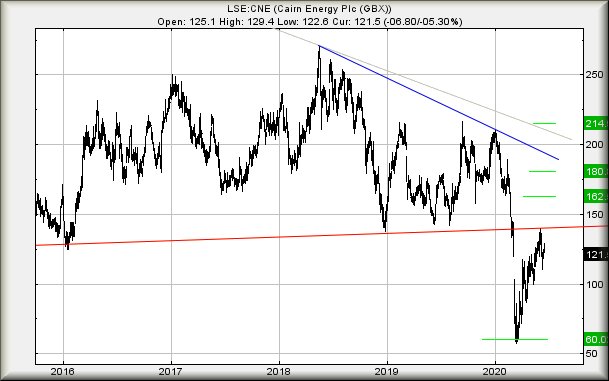
Of course, this brings us clumsily to our prediction for Cairn, given eleven months ago when it was trading at 173p. The price indeed reversed, eventually closing a session at 60.7p. While during the trading day, it fell to 57p, we feel the fact it did not close below 60p shall prove important. And yes, of course we’re chuffed at making this accurate prediction, especially as the bounce has seen the share price more than double.
We’re fascinated with price movements since the bottom was achieved at 60p. As the chart below highlights, the share has proven reticent about regaining the historical Red uptrend. Sometimes, when a price pays homage to a prior trend, any movement above such a level tends prove quite flamboyant. In the case of Cairn Energy, exceeding Red (presently 142p) should make travel to 162p almost a foregone conclusion. If exceeded, our secondary works out at 180p and presents a price level where we anticipate some hesitation occurring. Visually, it’s easy to imagine 180p bonking against the immediate Blue downtrend but more importantly, it also matches the false dawn spike of February 2020. This results in a situation where 180p presents itself as a “Glass Ceiling in Waiting!”.
For now, we’re fairly impressed with Cairn but we do need remind readers of 2 caveats. Firstly, we cannot calculate below 60p and secondly, despite our previous prediction, past performance is no guarantee of the future.
FUTURES
| Time Issued | Market | Price At Issue | Short Entry | Fast Exit | Slow Exit | Stop | Long Entry | Fast Exit | Slow Exit | Stop | Prior |
| 9:36:26PM | FTSE | 6279 | ‘cess | ||||||||
| 9:39:30PM | BRENT | 43.05 | |||||||||
| 9:48:53PM | GOLD | 1756.44 | 1742 | 1735.5 | 1726 | 1753 | 1764 | 1771 | 1780 | 1749 | ‘cess |
| 9:51:02PM | FRANCE | 4974.7 | 4897 | 4886 | 4846 | 4952 | 4987 | 4996.5 | 5020 | 4950 | |
| 9:53:04PM | GERMANY | 12362 | |||||||||
| 9:54:43PM | US500 | 3124.27 | |||||||||
| 9:56:23PM | DOW | 26101 | |||||||||
| 9:58:37PM | NASDAQ | 10141 | Success | ||||||||
| 10:00:23PM | JAPAN | 22598 | ‘cess |
