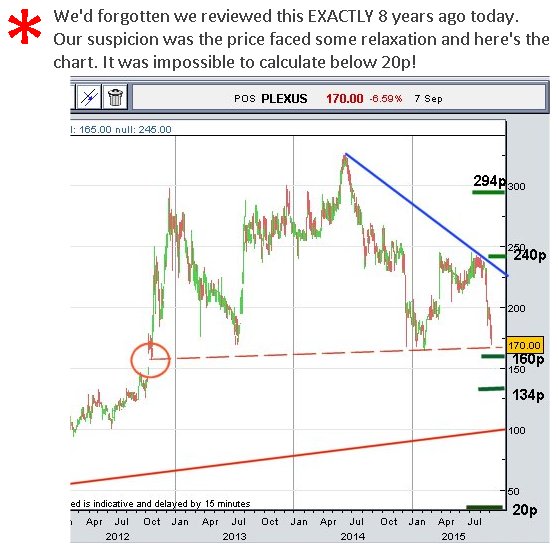
#FTSE #Nasdaq Our second reader request of the week surprised us. With the incessant range of dire insurance company adverts on television, it’s easy to assume most investors would steer clear of the sector, lest they end up in catchphrase hell. DLG even make this clear on their homepage, describing their various brands as “each having its own clearly defined personality”. Our own assumption would be they’d rate brands by profitability, rather than whether a cartoon character was fooling the gullible.
Ongoing efforts by corporate bodies to present themselves as cuddly, friendly, responsive, often tend utterly fall apart in the face of any difficulty. In our own household, we’ve annual reasons for fury, namely insurance renewals. Quite why an insurance company thinks it’s a good idea to double policy costs defeats us, making us suspect it’s because we’ve failed to burn our house down, crash each car, and claimed on pet insurance. But, here in Argyll, very little ever happens aside from cries of fury, when people open insurance renewal quotes. And then spending time on comparison websites to discover the extent of attempted fraud perpetuated by the insurance industry quickly reminds how crooked the business is, once their cuddly dogs, singing admirals, phones with wheels, are ignored.
Following a particular event with one of the biggies, we’re now careful to visit bank payment mandates to ensure nothing is set to automatically renew. Instead, insurance renewal has become an annual declaration of war against an industry attempting to paint themselves as having ethics. Thankfully, we ensured ALL our domestic policies fall due for renewal every June, making the time of battle a fairly short and sharp period.
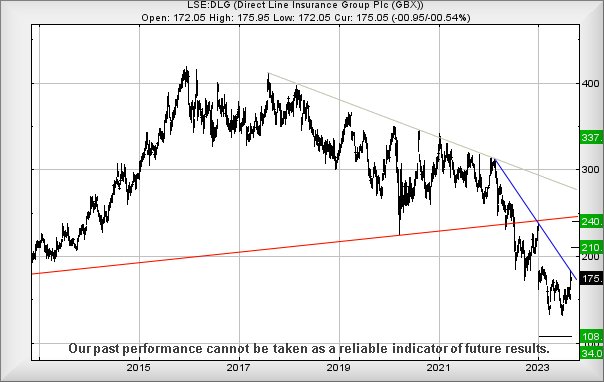
Despite our rather negative view of the insurance industry, for DLG there appears a good reason to keep an eye on them in the months to come. Currently, above 184p looks capable of triggering share price recovery to 210p with secondary, if bettered, calculating at 240p and essentially undoing all the damage to their share price during 2023. At this level, the visuals imply plenty of reason for some hesitation to occur but crucially, closure above 240 shall be viewed as important, taking the share price into a region where a future 337p can be hoped.
However, things are currently far from “safe” as below 150p risks promoting reversal to a cuddly 108p and an almost certain rebound. Our secondary, should such a level break, calculates down at a less likely 34p.
Overall, we feel the imperative from 108p has already shown some strength in the share price as the recent dips to the 130’s look like the market has deemed the drops as “close enough”. Should this visual impression be correct, this is perhaps worth keeping an eye on.
FUTURES
| Time Issued | Market | Price At Issue | Short Entry | Fast Exit | Slow Exit | Stop | Long Entry | Fast Exit | Slow Exit | Stop | Prior |
| 9:36:22PM | BRENT | 9171.9 | Success | ||||||||
| 9:39:17PM | GOLD | 1913.15 | Success | ||||||||
| 9:41:45PM | FTSE | 7515.8 | 7495 | 7484 | 7462 | 7520 | 7533 | 7554 | 7567 | 7513 | |
| 9:44:07PM | STOX50 | 4239.5 | |||||||||
| 9:47:57PM | GERMANY | 15705.6 | |||||||||
| 9:53:41PM | US500 | 4463.5 | |||||||||
| 10:19:53PM | DOW | 34651 | ‘cess | ||||||||
| 10:22:59PM | NASDAQ | 15297.4 | 15284 | 15262 | 15189 | 15339 | 15439 | 15467 | 15530 | 15373 | |
| 10:25:18PM | JAPAN | 32774 | ‘cess |
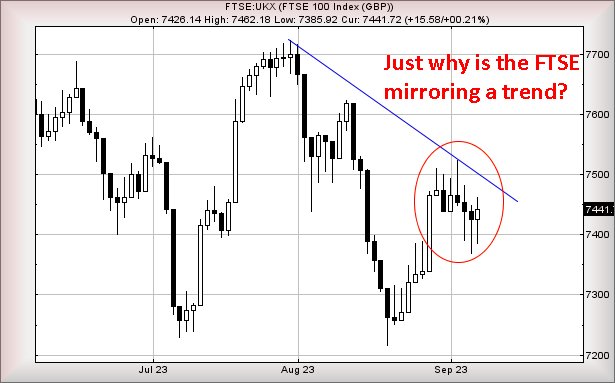
12/09/2023 FTSE Closed at 7527 points. Change of 0.41%. Total value traded through LSE was: £ 4,648,224,872 a change of 0.61%
11/09/2023 FTSE Closed at 7496 points. Change of 0.24%. Total value traded through LSE was: £ 4,619,826,018 a change of -15.09%
8/09/2023 FTSE Closed at 7478 points. Change of 0.5%. Total value traded through LSE was: £ 5,440,944,541 a change of 24.28%
7/09/2023 FTSE Closed at 7441 points. Change of 0.2%. Total value traded through LSE was: £ 4,377,889,513 a change of 26.38%
6/09/2023 FTSE Closed at 7426 points. Change of -0.15%. Total value traded through LSE was: £ 3,464,082,337 a change of -12.27%
5/09/2023 FTSE Closed at 7437 points. Change of -0.2%. Total value traded through LSE was: £ 3,948,449,247 a change of 27.07%
4/09/2023 FTSE Closed at 7452 points. Change of -0.16%. Total value traded through LSE was: £ 3,107,267,145 a change of -28.59%
SUCCESS above means both FAST & SLOW targets were met. ‘CESS means just the FAST target met and probably the next time it is exceeded, movement to the SLOW target shall commence.
Our commentary is in two sections. Immediately below are today’s updated comments. If our commentary remains valid, the share can be found in the bottom section which has a RED heading. Hopefully, this will mean you no longer need to flip back through previous reports. HYPERLINKS DISABLED IN THIS VERSION
Please remember, all prices are mid-price (halfway between the Buy and Sell). When we refer to a price CLOSING above a specific level, we are viewing the point where we can regard a trend as changing. Otherwise, we are simply speculating on near term trading targets. Our website is www.trendsandtargets.com.
UPDATE. We often give an initial and a secondary price. If the initial is exceeded, we still expect it to fall back but the next time the initial is bettered, the price should continue to the secondary. The converse it true with price drops.
We can be contacted at info@trendsandtargets.com. Spam filters set to maximum so only legit emails get through…
Section One – Outlook Updated Today. Click here for Section Two – Outlook Remains Valid shares
Click Epic to jump to share: LSE:BP. BP PLC** **LSE:DGE Diageo** **LSE:EME Empyrean** **LSE:IHG Intercontinental Hotels Group** **LSE:IQE IQE** **LSE:RR. Rolls Royce** **
********
Updated charts published on : BP PLC, Diageo, Empyrean, Intercontinental Hotels Group, IQE, Rolls Royce,
LSE:BP. BP PLC. Close Mid-Price: 522.8 Percentage Change: + 1.06% Day High: 523.3 Day Low: 513
Further movement against BP PLC ABOVE 523.3 should improve acceleration t ……..
</p
View Previous BP PLC & Big Picture ***
LSE:DGE Diageo Close Mid-Price: 3162 Percentage Change: -0.43% Day High: 3195 Day Low: 3160.5
In the event Diageo experiences weakness below 3160.5 it calculates with ……..
</p
View Previous Diageo & Big Picture ***
LSE:EME Empyrean Close Mid-Price: 0.88 Percentage Change: -10.25% Day High: 1.07 Day Low: 0.95
This stinks a little bit, due to an attempt being made to assure the marke ……..
</p
View Previous Empyrean & Big Picture ***
LSE:IHG Intercontinental Hotels Group. Close Mid-Price: 6168 Percentage Change: + 0.75% Day High: 6184 Day Low: 6136
In the event of Intercontinental Hotels Group enjoying further trades bey ……..
</p
View Previous Intercontinental Hotels Group & Big Picture ***
LSE:IQE IQE. Close Mid-Price: 17 Percentage Change: + 3.28% Day High: 17.6 Day Low: 15.6
Continued weakness against IQE taking the price below 15.6 calculates as ……..
</p
View Previous IQE & Big Picture ***
LSE:RR. Rolls Royce. Close Mid-Price: 224.4 Percentage Change: + 0.36% Day High: 226.1 Day Low: 222.8
Further movement against Rolls Royce ABOVE 226.1 should improve accelerat ……..
</p
View Previous Rolls Royce & Big Picture ***