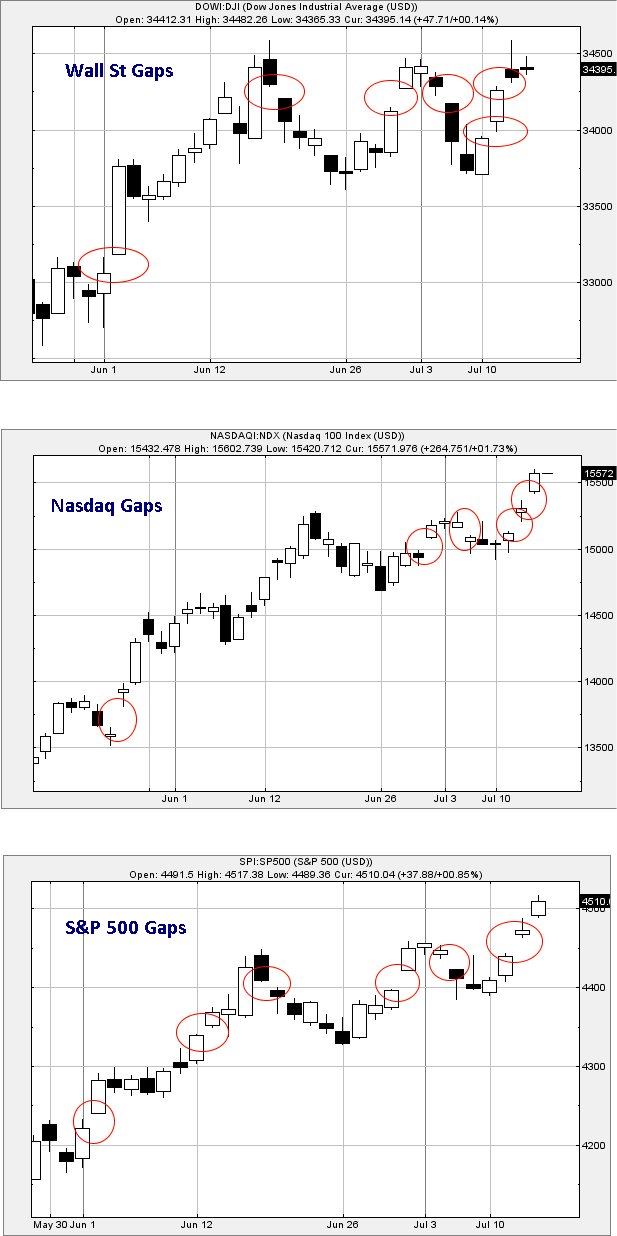
#Nasdaq #FTSE There’s something a bit odd going on with the USA markets. The three charts below reveal the cause of our unease, the sheer number of manipulation gaps appearing across the US indices. While this is fairly normal during the holiday period, everything has been kicking off since the start of June, giving the impression the US markets still intend a further nudge upward with the Dow Jones potentially heading to just above 35,000 points eventually. While we basically distrust the use of gaps to force prices upward, due things often ending in tears in the fullness of time, for now it’s hard to disregard the potential “tops” of around 4,670 for the S&P and 16,900 for the Nasdaq.
If things intend start to go horribly wrong, below 13,740 should give the first impression of trouble on the Nasdaq, for the S&P below 4,270 will justify worry lines, and under 32,800 will give greater concern than worrying about Boris Johnston discovering his phone can be hacked to unlock it.
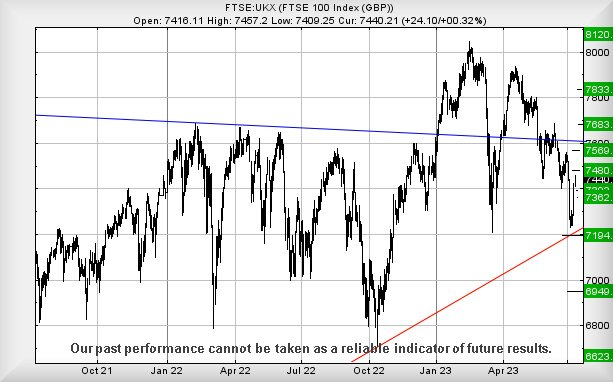
As for Friday and the FTSE, things currently look fairly useful as above 7458 points should trigger index movement to an initial fairly tame 7480 points. Our secondary, if such a level is exceeded, calculates at 7569 points and the threat of some hesitation, this value matching prior highs. However, this impetus fails to return the index value above the Blue downtrend on the chart, a line since 2018 which the market seems to be assigning a degree of importance. Despite recent drops a bouncing from 7229 points rather than reach our 7206 target, our inclination is to distrust the bounce due to the index still trading below Blue.
Should movement upward be triggered, the tightest stop loss looks fairly reasonable at 7418 points.
Our converse scenario kicks in, should 7418 break (not with a downward spike at the market open!) as a visit to an initial 7392 works out as possible with secondary, if broken, at 7362 points, hopefully with a decent bounce.
FUTURES
| Time Issued | Market | Price At Issue | Short Entry | Fast Exit | Slow Exit | Stop | Long Entry | Fast Exit | Slow Exit | Stop | Prior |
| 10:15:06PM | BRENT | 8010.7 | 7910 | 7860 | 7969 | 8043 | 8117 | 7952 | Success | ||
| 10:16:49PM | GOLD | 1956.76 | 1924 | 1912 | 1941 | 1960 | 1971 | 1950 | Success | ||
| 10:18:58PM | FTSE | 7406.2 | 7351 | 7320 | 7407 | 7428 | 7460 | 7380 | Success | ||
| 10:21:32PM | STOX50 | 4357.2 | 4303 | 4293 | 4330 | 4368 | 4385 | 4338 | ‘cess | ||
| 10:25:39PM | GERMANY | 16009.8 | 15806 | 15695 | 15875 | 16048 | 16147 | 15955 | ‘cess | ||
| 10:28:06PM | US500 | 4474.4 | 4436 | 4416 | 4453 | 4485 | 4490 | 4472 | Success | ||
| 10:30:54PM | DOW | 34356 | 34216 | 34111 | 34346 | 34588 | 34638 | 34409 | Success | ||
| 10:32:43PM | NASDAQ | 15316.6 | 15115 | 15071 | 15165 | 15365 | 15398 | 15279 | Success | ||
| 10:37:34PM | JAPAN | 32036 | 31999 | 31920 | 32093 | 32155 | 32299 | 32031 |
13/07/2023 FTSE Closed at 7440 points. Change of 0.32%. Total value traded through LSE was: £ 4,652,935,320 a change of -35.19%
12/07/2023 FTSE Closed at 7416 points. Change of 1.84%. Total value traded through LSE was: £ 7,179,397,183 a change of 76.59%
11/07/2023 FTSE Closed at 7282 points. Change of 0.12%. Total value traded through LSE was: £ 4,065,629,486 a change of 3.17%
10/07/2023 FTSE Closed at 7273 points. Change of 0.23%. Total value traded through LSE was: £ 3,940,608,069 a change of 3.75%
7/07/2023 FTSE Closed at 7256 points. Change of -0.33%. Total value traded through LSE was: £ 3,798,027,374 a change of -31.82%
6/07/2023 FTSE Closed at 7280 points. Change of -2.18%. Total value traded through LSE was: £ 5,570,653,867 a change of 7.74%
5/07/2023 FTSE Closed at 7442 points. Change of -1.02%. Total value traded through LSE was: £ 5,170,439,166 a change of 50.69% 
SUCCESS above means both FAST & SLOW targets were met. ‘CESS means just the FAST target met and probably the next time it is exceeded, movement to the SLOW target shall commence.
Our commentary is in two sections. Immediately below are today’s updated comments. If our commentary remains valid, the share can be found in the bottom section which has a RED heading. Hopefully, this will mean you no longer need to flip back through previous reports. HYPERLINKS DISABLED IN THIS VERSION
Please remember, all prices are mid-price (halfway between the Buy and Sell). When we refer to a price CLOSING above a specific level, we are viewing the point where we can regard a trend as changing. Otherwise, we are simply speculating on near term trading targets. Our website is www.trendsandtargets.com.
UPDATE. We often give an initial and a secondary price. If the initial is exceeded, we still expect it to fall back but the next time the initial is bettered, the price should continue to the secondary. The converse it true with price drops.
We can be contacted at info@trendsandtargets.com. Spam filters set to maximum so only legit emails get through…
Section One – Outlook Updated Today. Click here for Section Two – Outlook Remains Valid shares
Click Epic to jump to share: LSE:ASC Asos** **LSE:BDEV Barrett Devs** **LSE:MMAG Music Magpie** **LSE:OPG OPG Power Ventures** **LSE:ZOO Zoo Digital** **
********
Updated charts published on : Asos, Barrett Devs, Music Magpie, OPG Power Ventures, Zoo Digital,
LSE:ASC Asos. Close Mid-Price: 377 Percentage Change: + 2.81% Day High: 394.8 Day Low: 367
Further movement against Asos ABOVE 394.8 should improve acceleration tow ……..
</p
View Previous Asos & Big Picture ***
LSE:BDEV Barrett Devs Close Mid-Price: 411.2 Percentage Change: -1.63% Day High: 412.2 Day Low: 395.3
If Barrett Devs experiences continued weakness below 395.3, it will invar ……..
</p
View Previous Barrett Devs & Big Picture ***
LSE:MMAG Music Magpie Close Mid-Price: 15.25 Percentage Change: -18.67% Day High: 18.75 Day Low: 15.25
This is messy as below 15.25 now suggests a visit to 12p next with seconda ……..
</p
View Previous Music Magpie & Big Picture ***
LSE:OPG OPG Power Ventures. Close Mid-Price: 8.25 Percentage Change: + 0.00% Day High: 8.25 Day Low: 8.07
Below 8 currently suggests weakness to an initial 7.6 with secondary, if b ……..
</p
View Previous OPG Power Ventures & Big Picture ***
LSE:ZOO Zoo Digital Close Mid-Price: 104.5 Percentage Change: -4.13% Day High: 109 Day Low: 104
Weakness on Zoo Digital below 104 will invariably lead to 99 next and hop ……..
</p
View Previous Zoo Digital & Big Picture ***