#Gold #S&P500 A bunch of emails impressed us on Monday, all essentially asking where we think Empire Metals share price intends heading. In many cases, it’s easier predicting what a cat will do next, rather than the share price of a member of the UK AIM market. But in this instance, some considerable hope appears possible, especially as price movements don’t “feel” like the victim of an optimism overdose from internet share chat rooms.
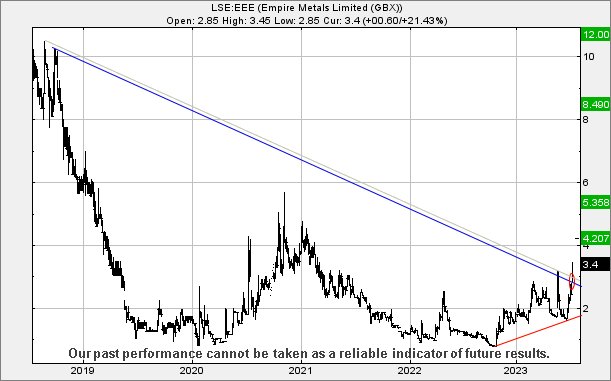
An interesting facet – from our nerdy perspective – was the decision to gap the share price above the Blue Closing Price downtrend which dates back to 2018. Traditionally, proper trend lines reflect the High of the Day for downtrends and the Low of the Day for uptrends. Just to muddy the waters a bit, we also review Day Closing Price trends as sometimes they reveal a facet of share price dance steps we hadn’t expected. In the case of Empire, the decision to gap (manipulate) the price up above the closing price trend was truly unusual and, as the chart extract below shows, creating a positive impression which ideally indicates everything has changed for this miner. We often refer to a need for a shares closing price to move above a specific level but cannot remember any single instance where it was a closing price trend line creating such a visually pleasing signal.
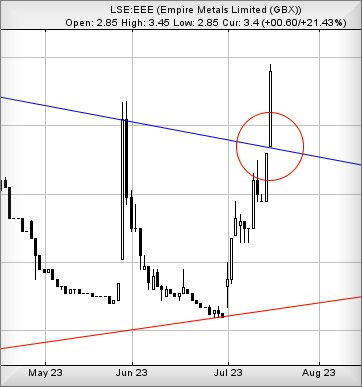
The suggestion now is of movement above 3.5p triggering price growth to 4.2p next with our “longer term” secondary, if bettered, working out at 5.35p. This ambition at 5.35p is one of these price levels where it becomes important for the share value to actually close a session above 5.35p, thanks to some quite extraordinary potentials making themselves felt for the long term.
For now, if the share price intends spoil the party, it needs below 2.45p to provide genuine cause for concern.
It certainly appears this Copper, Gold, and additional valuable mineral producer is on the edge of becoming useful.
FUTURES
| Time Issued | Market | Price At Issue | Short Entry | Fast Exit | Slow Exit | Stop | Long Entry | Fast Exit | Slow Exit | Stop | Prior |
| 9:42:59PM | BRENT | 7826.9 | ‘cess | ||||||||
| 9:45:01PM | GOLD | 1954.36 | 1947 | 1943 | 1936 | 1956 | 1960 | 1962 | 1967 | 1950 | Success |
| 9:47:03PM | FTSE | 7411.3 | |||||||||
| 9:49:14PM | STOX50 | 4358.9 | ‘cess | ||||||||
| 9:51:33PM | GERMANY | 16075.2 | ‘cess | ||||||||
| 9:53:43PM | US500 | 4517.6 | 4496 | 4486 | 4470 | 4510 | 4534 | 4538 | 4552 | 4506 | |
| 9:56:43PM | DOW | 34568.5 | Success | ||||||||
| 10:20:56PM | NASDAQ | 15693 | Success | ||||||||
| 10:23:39PM | JAPAN | 32363 | ‘cess |
17/07/2023 FTSE Closed at 7406 points. Change of -0.38%. Total value traded through LSE was: £ 3,946,111,838 a change of 6.88%
14/07/2023 FTSE Closed at 7434 points. Change of -0.08%. Total value traded through LSE was: £ 3,691,976,999 a change of -20.65%
13/07/2023 FTSE Closed at 7440 points. Change of 0.32%. Total value traded through LSE was: £ 4,652,935,320 a change of -35.19%
12/07/2023 FTSE Closed at 7416 points. Change of 1.84%. Total value traded through LSE was: £ 7,179,397,183 a change of 76.59%
11/07/2023 FTSE Closed at 7282 points. Change of 0.12%. Total value traded through LSE was: £ 4,065,629,486 a change of 3.17%
10/07/2023 FTSE Closed at 7273 points. Change of 0.23%. Total value traded through LSE was: £ 3,940,608,069 a change of 3.75%
7/07/2023 FTSE Closed at 7256 points. Change of -0.33%. Total value traded through LSE was: £ 3,798,027,374 a change of -31.82% 
SUCCESS above means both FAST & SLOW targets were met. ‘CESS means just the FAST target met and probably the next time it is exceeded, movement to the SLOW target shall commence.
Our commentary is in two sections. Immediately below are today’s updated comments. If our commentary remains valid, the share can be found in the bottom section which has a RED heading. Hopefully, this will mean you no longer need to flip back through previous reports. HYPERLINKS DISABLED IN THIS VERSION
Please remember, all prices are mid-price (halfway between the Buy and Sell). When we refer to a price CLOSING above a specific level, we are viewing the point where we can regard a trend as changing. Otherwise, we are simply speculating on near term trading targets. Our website is www.trendsandtargets.com.
UPDATE. We often give an initial and a secondary price. If the initial is exceeded, we still expect it to fall back but the next time the initial is bettered, the price should continue to the secondary. The converse it true with price drops.
We can be contacted at info@trendsandtargets.com. Spam filters set to maximum so only legit emails get through…
Section One – Outlook Updated Today. Click here for Section Two – Outlook Remains Valid shares
Click Epic to jump to share: LSE:AFC AFC Energy** **LSE:SCLP Scancell** **LSE:TLW Tullow** **LSE:ZOO Zoo Digital** **
********
Updated charts published on : AFC Energy, Scancell, Tullow, Zoo Digital,
LSE:AFC AFC Energy Close Mid-Price: 11.28 Percentage Change: -1.05% Day High: 11.64 Day Low: 11.28
If AFC Energy experiences continued weakness below 11.28, it will invaria ……..
</p
View Previous AFC Energy & Big Picture ***
LSE:SCLP Scancell Close Mid-Price: 8.75 Percentage Change: -11.17% Day High: 9.85 Day Low: 8.75
Target met. Continued weakness against SCLP taking the price below 8.75 c ……..
</p
View Previous Scancell & Big Picture ***
LSE:TLW Tullow. Close Mid-Price: 33.76 Percentage Change: + 9.11% Day High: 34.3 Day Low: 30.76
Continued trades against TLW with a mid-price ABOVE 34.3 should improve t ……..
</p
View Previous Tullow & Big Picture ***
LSE:ZOO Zoo Digital Close Mid-Price: 63 Percentage Change: -4.55% Day High: 65 Day Low: 58.5
If Zoo Digital experiences continued weakness below 58.5, it will invaria ……..
</p
View Previous Zoo Digital & Big Picture ***