FTSE for 5/07/2019

#DOW #Gold Once again, we spent US Indie day regretting getting out of bed. Market financial volumes hit Xmas week levels with the number of shares pretending to do anything at an absolute minimum. Why does the UK not have a couple of public holidays, dedicated to making folk feel good about themselves and their country? Perhaps this is the cunning plan for Brexit, to create a new Independence Day holiday!

We keep whinging about the media & politicians, many of which indulge in a sport of talking the future down. Unsurprisingly, these appear the same folks who warned of calamity if Mr Trump became US president, remaining gleefully highlighting anything wrong, regardless of what actually happens. Yet in the period since the US elected their disaster, the country appears better than ever with US markets achieving all time highs. It’s easy to speculate such a dreadful fate awaits the UK, once everything is shaken up by Brexit and a new clown is successfully appointed Prime Minister.

All joking aside, someone recently suggested many UK politicians (and European ones too) are utterly dreadful, because they don’t really need do a job, due to the EU indulging in heavy lifting for legislative purposes. This has created a tranche of ‘Z List’ politicians across member states, many of whom should only aspire to be local councillors at best.

The comment certainly gave some pause for thought.

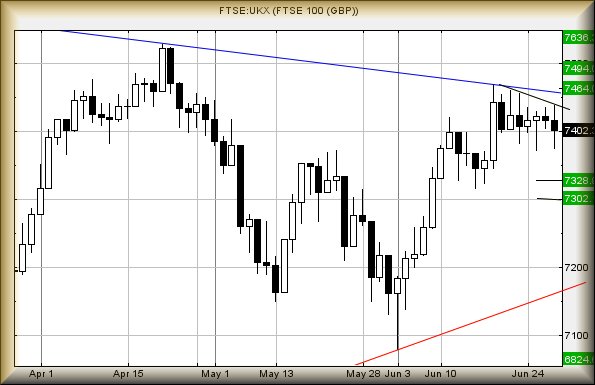
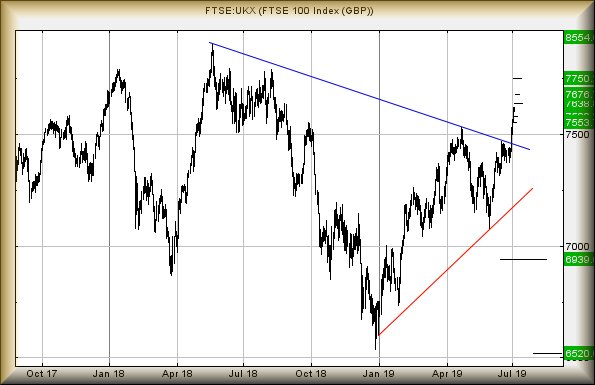
One of the more common questions being asked relates to spotting early signs of proper market reversal. At present, the FTSE requires break RED on the chart, presently at 7170 points, to justify concern as this looks capable of driving the index back to the 6939 level. In itself, not the most tragic state of affairs but should 6939 break, the index risks easily trashing itself down to 6520 and a new low. This would prove a very bad thing.

On the FTSE for FRIDAY, we doubt this state of affairs risks arising anytime soon as above 7622 now looks capable of a near term 7638 points. While pretty useless, secondary at 7676 is certainly more appealing for the days ahead. Or perhaps tomorrow.

The alternate, near term, if of weakness below 7595 driving the index back to 7580 initially. If broken, secondary calculates at 7553, along with the risk of further reversals in the week ahead.

Worse still, if we examine the dire state of the US market under President Trumps domain and extrapolate a similar terrible state of affairs forward, it’s remarkably easy to calculate the UK FTSE as already on course for a long term 8554 points. It needs below the aforementioned RED line to cancel this prospect.

Have a good weekend. At time of writing, it’s 9 days and 14 hours until the British Grand Prix, along with epic traffic jams around the venue.

FUTURES

Time Issued

Market

Price At Issue

Short Entry

Fast Exit

Slow Exit

Stop

Long Entry

Fast Exit

Slow Exit

Stop

Prior

10:17:36PM

BRENT

63.12

62.86

62.37


63.7

63.87

64.165


62.86

10:19:12PM

GOLD

1415.88

1410

1399


1422

1421

1423.5


1411

10:20:44PM

FTSE

7602.22

7596

7587


7613

7623

7646


7596

10:22:34PM

FRANCE

5615.2

5612

5607


5625

5631

5641


5612

10:26:53PM

GERMANY

12635

12618

12598


12642

12660

12676


12622

10:28:55PM

US500

2999.07

2979

2974.5


3000

3000

3002


2983

10:31:55PM

DOW

26996.7

26887

26868.5


26999

27005

27046.5


26914

10:34:53PM

NASDAQ

7875.87

7854

7843.5


7881

7881

7885.5


7862

10:36:29PM

JAPAN

21673

21652

21616.5


21705

21733

21765.5


21652

4/07/2019 FTSE Closed at 7603 points. Change of -0.08%. Total value traded through LSE was: £ 3,830,628,051 a change of -34.34%

3/07/2019 FTSE Closed at 7609 points. Change of 0.66%. Total value traded through LSE was: £ 5,833,923,345 a change of -4.39%

RBS for 4/07/2019

#DOW #GOLD We’d tried to skip RBS in our Retail Bank analysis recently. Essentially it proved difficult to whip up enthusiasm for a months price moves which frankly make the UK PM contest seem exciting and vibrant. However, there are slight signs things with RBS are about to become slightly interesting.

Movements now above 225p indicate the prospect of some recovery in the near future with 234p calculating as an immediate prospect. If this ambition appears, there’s a fairly firm suggestion we’ve spent the last year scanning movements against The Wrong Trend! What alarmed us this week was how the share price opened on Monday. The market opted to gap the price up, suggesting “they” were skipping over a trend. If this proves the case and 234p makes an appearance anytime soon, our secondary, if bettered, calculates at 253p.

We have considerable doubts regarding this and the lower chart gives a fairly straightforward visual excuse. It appears the market is asking us to believe RBS share price was jumped across a downtrend which started in 2008! We’re just a little sceptical about this, if only due to RBS previously triggering what seemed a solid movement down to 202p.

In theory, our 202p target level is now void but on this occasion, our inclination is to distrust software and instead fear the worst. After all, we’ve identified a market strategy when a share price is magically Gapped UP, then Gapped DOWN a few days later. This tends indicate a price is about to be roasted.

For RBS, this will mean weakness below 212 should propel the share down to 202p initially with secondary, if broken, at 177p. In fact, it could easily tumble to 149p eventually with the correct blend of toxic news and market conditions polluted by UK politics.

For now, we shall watch carefully for the price actually closing above 234p as this should make future tumultuous drops difficult.

FUTURES

Time Issued

Market

Price At Issue

Short Entry

Fast Exit

Slow Exit

Stop

Long Entry

Fast Exit

Slow Exit

Stop

Prior

10:15:30PM

BRENT

63.8


10:18:30PM

GOLD

1419.29

1411

1405

1394

1423

1430

1441

1461

1412

‘cess

10:20:42PM

FTSE

7619.98


‘cess

10:22:38PM

FRANCE

5630.7


Success

10:35:46PM

GERMANY

12659


‘cess

10:37:52PM

US500

2997


Success

10:40:27PM

DOW

26982

26820

26766

26692

26950

26990

27028.5

27170

26840

Success

10:42:12PM

NASDAQ

7862


‘cess

10:44:07PM

JAPAN

21713


Success

3/07/2019 FTSE Closed at 7609 points. Change of 0.66%. Total value traded through LSE was: £ 5,833,923,345 a change of -4.39%

Glencore for 3/07/2019

#Nasdaq #CAC40 Our last public review of Glencore was back in February this year, when we provided criteria for a 10% share price rise. Despite relative chaos in the world of heavy metal, this ambition was successfully achieved and exceeded. What has happened since is melting our collective brain cell!

At present, the share is trading around the 279 level and unfortunately, despite beating our prior secondary target with a lunge to 340p, the price has broken the uptrend since the start of 2016 and in doing so, is painting a series of “lower lows”. From our perspective, the news is quite grim as trades below 248p (which we suspect shall happen) look capable of driving reversal down to an initial 228p.

Worse, if such a level breaks, our secondary is a theoretical “bottom” of 193p. We’re forced to use the term “bottom” quite loosely, thanks to the visuals tending suggest 132p should be “bottom” for a real bounce. To achieve such a low, we’d suspect either negative news flow or, more probably, negative market conditions, shall conspire to provoke 132p making an appearance.

At present, the share price needs exceed 300p just to regain the prior trend. In such an event, we calculate an initial price target of 312p with secondary, if bettered, a pretty comfortable looking 346p.

For now, we fear the worst, suspecting 132p shall prove irresistible.

FUTURES

Time Issued

Market

Price At Issue

Short Entry

Fast Exit

Slow Exit

Stop

Long Entry

Fast Exit

Slow Exit

Stop

Prior

10:50:23PM

BRENT

62.69


Success

10:52:12PM

GOLD

1419.19


Success

10:55:04PM

FTSE

7573.98


Success

10:57:14PM

FRANCE

5580

5554

5535.5

5510

5590

5590

5599

5614

5561

10:58:53PM

GERMANY

12559


11:01:28PM

US500

2974.87


‘cess

11:03:39PM

DOW

26801


11:06:34PM

NASDAQ

7814

7735

7703

7665

7798

7820

7834.5

7871

7762

Shambles

11:08:29PM

JAPAN

21693


2/07/2019 FTSE Closed at 7559 points. Change of 0.83%. Total value traded through LSE was: £ 6,102,081,659 a change of 7.26%

Ferrari for 2/07/2019

#GOLD #US500 Last time we reviewed Ferrari (link here), we speculated on the price reaching 160, along with an argument in favour of the marque proving supreme in Formula One this year. From our perspective, we got the important question right but their World Championship chances look dodgy.

Ferrari share price in New York has achieved an all time high, exceeding our 160 and now trading at record levels. The next phase of a “safe” price climb shall come, if it trades beyond 165 dollars. Recent days brought highs of 163.7, close to our 165 trigger level but still not exceeding it. Perhaps if Ferrari get a thrashing at their next outing to the British Grand Prix, we shall see the share soar higher again.

The important thing, if 165 bettered, is we’re showing the potential of 188 making an appearance, a point at which we’d normally anticipate some turbulence. If 188 exceeded, the price could easily accelerate to 193p (okay, both targets are essentially the same) but we really will expect some reversals – perhaps short term – to take hold at these levels.

Given the share prices form this year, the worst thing which could happen will be Ferrari starting to win races, just in case the converse of price growth appears! In such an instance, the share requires CLOSE a session below RED, presently at 148 dollars. A disaster like this is liable to promote a visit to 140 with little chance of a successful complaint to the stewards. A larger, more painful, issue arises if 140 breaks as “bottom” should prove to be 121 dollars.

Unusually, we’ve painted the RED uptrend against Ferrari’s daily share price closing level. Most of the time, we regard this as foolish but there’s little doubt the real uptrend is being defined by the the point at which the share closes each day and NOT the low of the day. This is quite important but makes us question price moves at the beginning of May. Often, this sort of trend break serves as early warning, almost like ‘proof’ the trend is not sacrosanct and can be broken.

FUTURES

Time Issued

Market

Price At Issue

Short Entry

Fast Exit

Slow Exit

Stop

Long Entry

Fast Exit

Slow Exit

Stop

Prior

9:55:07PM

BRENT

65.16


‘cess

9:57:57PM

GOLD

1384.05

1381

1377.5

1357

1398

1396

1399

1405

1386

Success

10:01:22PM

FTSE

7508


Success

10:05:48PM

FRANCE

5575


Success

10:08:04PM

GERMANY

12541.62


Success

10:10:28PM

US500

2964.62

2951

2946.5

2936

2967

2971

2976.5

3012

2950

Success

10:13:34PM

DOW

26704


Success

10:21:01PM

NASDAQ

7766


Success

10:23:14PM

JAPAN

21699


Success


1/07/2019 FTSE Closed at 7497 points. Change of 0.97%. Total value traded through LSE was: £ 5,688,983,351 a change of -13.08%

Bitcoin etc for 1/07/2019

Barclays, Lloyds, Kingfisher and the Movie: Yesterday thoughts. We’re opting to start the week with an update on items reviewed last week and anything else which takes our fancy. Being “dragged” to watch “Yesterday” proved a pleasant surprise, a good film and tempted to go AGAIN! As for the important things, Bitcoin comes first.

To deal with Bitcoin, what happened proved quite fascinating from our nerdy perspective. At 5:30pm on Wed 26th, it achieved our 13,286 dollars. Better still, the phony currency exceeded target on the first surge, hitting 13,292 before sharply falling back to target level. This (thankfully) confirmed we’d been monitoring the correct trend but such was the pace of Bitcoin acceleration that next time it exceeded our target level, the price powered on upward to 13,880. And then, it dropped like a stone, almost feeling like the market “knew” it had gone to high and needed stuffed back under its rock.

The immediate problem is fairly straightforward. At present, it’s trading around the 11k level, needing below 10,200 to enter a cycle down to 9,300 and ideally a proper rebound.

It now requires – according to our criteria anyway – to trade above 12,925 as this calculates as entering a cycle to an initial 13,980 dollars. If bettered, secondary is at 14,550 and a new high since it broke an important downtrend. This sort of thing takes the price firmly into a region where a “long term – or later that day” target of 16,560 looks pretty certain to provoke some hesitation in any further upward surge.

Kingfisher appear to be doing something worthwhile. Our report (link here) mentioned the importance of the price bettering 222p anytime soon as it takes the share into a region with an initial 235p and beyond. From the point at which it closed last week, it should prove worth watching in the days ahead.

Barclays theoretically does not need discussed, the share price continuing to wobble around in a Zombie state. While our report (link here) demands in better 162p to be taken seriously, it will probably be worth watching for trades exceeding 152p in the week ahead, due to an initial 157 looking possible with secondary 160p. While neither is sufficient to remove the share from Big Picture trouble, it will illustrate rather neatly the reality of prices rarely going straight UP or DOWN.

Lloyds assiduously avoided breaking below our 56p trigger level (Report link here) but to be honest, we’ve little confidence in the price. However, Friday’s session commenced with a peculiar price movement, one which apparently calculates with near term movement above the days high of 57.43 being capable of some growth to a pretty tame looking 59.12p. If exceeded, secondary is at 60.3p. As explained with Barclays above, neither target proves sufficient to extract the share price from danger.

FUTURES

Time Issued

Market

Price At Issue

Short Entry

Fast Exit

Slow Exit

Stop

Long Entry

Fast Exit

Slow Exit

Stop

Prior

12:01:42PM

BRENT

64.43

64.02

63.88

63.54

65.55

66.08

66.64

67.51

65.14

‘cess

12:03:32PM

GOLD

1409.9


‘cess

12:05:32PM

FTSE

7450.77


‘cess

12:07:17PM

FRANCE

5531


‘cess

12:09:27PM

GERMANY

12449.37

12314

12267

12206

12409

12450

12470.5

12514

12370

Success

12:11:10PM

US500

2950.17


Success

12:12:40PM

DOW

26654.4


3:11:46PM

NASDAQ

7696.99


3:14:19PM

JAPAN

21375


‘cess

28/06/2019 FTSE Closed at 7425 points. Change of 0.31%. Total value traded through LSE was: £ 6,545,369,204 a change of 24.51%

27/06/2019 FTSE Closed at 7402 points. Change of -0.19%. Total value traded through LSE was: £ 5,256,939,146 a change of -12.83%

FTSE & Bitcoin for 28/06/2019

#Nasdaq #DAX We started this week, proposing a scenario where Bitcoin could soar to 13,286 dollars. The scenario triggered, the phony currency actually achieving 13,800 before hitting a bit of turbulence. Perhaps turbulence is a bit of understatement, given the -20% thrashing it received. In fact, it may fall further.

Continued Bitcoin weakness below 10,330 calculates with the potential of a further 1,000 dollar drop. It “should” bounce by 9,330, especially due to it exceeding our earlier upward target. The implication given is of further strength in the future now calculating with 16,000 dollars and beyond.

Current behaviour highlights one of our great dislikes with Bitcoin. Traditionally, we give primary and secondary targets, our thinking being of turbulence at each target level. In the case of Bitcoin, it often vaguely follows “the rules” but with price swings more reminiscent of AIM shares 10 years ago. When ramping groups would seek to substantially enhance investors expectations, creating a buying frenzy for dodgy AIM companies, invariably this would leave a majority of investors “walking funny”. Thankfully, this is one area where market authorities tend exert some control and Pump & Dumps, while still present, are less frequent. Of course, there’s now Bitcoin available to damage traders wealth as its price swings can defy logic.

As for The FTSE for Friday (It closed Thursday at 7,402), we’ve a ruling expectation of the index heading to 7,328 points and hopefully a bottom. The market needs better 7,437 to escape the immediate downtrend, giving a pretty easy visual level for a stop loss. Anything near term below 7,375 should promote the final downhill drag to target. There is a problem, if 7,328 breaks. We obviously can calculate a secondary and it’s at 7,302 points, a level where a real rebound can be hoped.

Importantly, if we opt to review the upward potentials for the index, the market presently needs better 7,432 points to trigger a near term rise toward 7,464 points. We have some doubts about this, given it would exceed the market downtrend since May 2018! In the unlikely basis this proves correct, our secondary calculates at 7,464 and, rather amazingly, takes the UK market into a longer term region with 7,630 as a major ambition.

Have a good weekend. It’s the Austrian GP, generally quite a good one following the utter boredom supplied by France, yet again. Perhaps F1 management could do race fans a favour, ditching both Monaco and France from the annual event calendar as neither tend deliver an actual race.

FUTURES

Time Issued

Market

Price At Issue

Short Entry

Fast Exit

Slow Exit

Stop

Long Entry

Fast Exit

Slow Exit

Stop

Prior

9:55:17PM

BRENT

65.55


9:57:38PM

GOLD

1409.64


9:59:42PM

FTSE

7407.6


Shambles

10:02:28PM

FRANCE

5489.7


‘cess

10:05:17PM

GERMANY

12301

12216

12173

12119

12289

12335

12354

12403

12258

‘cess

10:06:46PM

US500

2929.22


10:09:11PM

DOW

26555


10:11:18PM

NASDAQ

7659.25

7620

7598

7534

7690

7690

7719.5

7753

7626

10:13:29PM

JAPAN

21222


‘cess

27/06/2019 FTSE Closed at 7402 points. Change of -0.19%. Total value traded through LSE was: £ 5,256,939,146 a change of -12.83%