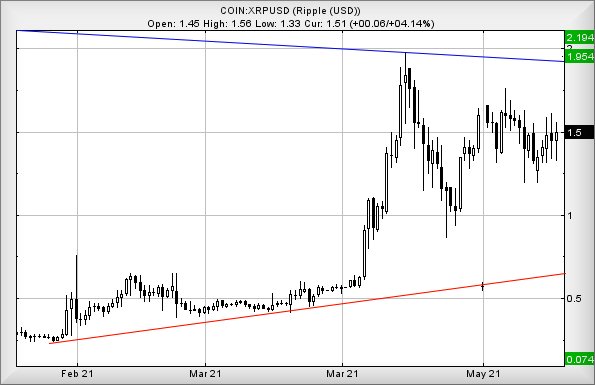
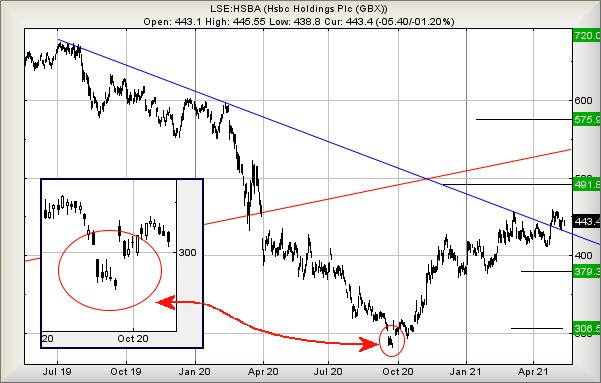
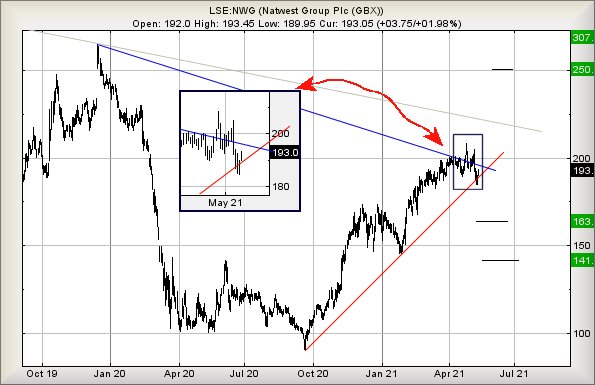
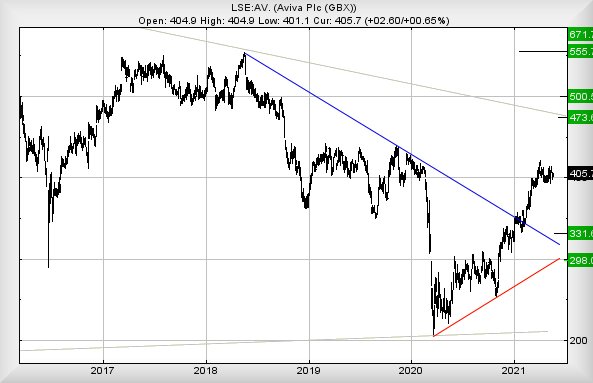
#Gold_Futures #Nasdaq #Aviva share price is currently experiencing the hesitation we anticipate from the FTSE, at some point in a future which increasingly feels very far away. Their share price has managed to equal the pre-pandemic high, spending the last few months stumbling around uselessly, obviously in shock at the temerity of its actions! We hesitate to use words like “Sure Thing” but when we examine this movement model on international markets, we’re able to give an interesting potential.
It will also be worth remembering the company are scheduled to issue a trading statement this Thursday, presumably something of greater interest than their attempt to steal headlines by warning of the risk of fires, this coming Bank Holiday weekend. Apparently BBQ’s rely on fire and thus, from an insurance standpoint, are a bad thing…
Presently trading around 406p, the share price only need exceed 421p to trigger some interesting recovery. Above 421p should look for gains in the direction of 473p with our longer term secondary, calculating at a solid looking 500p. Obviously, this assumption is based on what happened with similar shares internationally, when they finally broke above the pre-Covid highs of February 2020. It’s something of a surprise to note this scenario allegedly has a long term attraction coming from 671p, a price level absent from Aviva since 2008. We’re less than convinced at this potential but the arguments favouring 473/500p are proving strong.
If we chose to look at the dark side, the earliest warning for things going wrong for Aviva shall come, if the share price manages to trade below 373p. This risks trouble as we can calculate an initial target of 331p, a level at which we’d hope for a rebound. If broken, our secondary calculation works out at 298p and represents a point where we shall need review all the numbers again.
FUTURES
| Time Issued | Market | Price At Issue | Short Entry | Fast Exit | Slow Exit | Stop | Long Entry | Fast Exit | Slow Exit | Stop | Prior |
| 9:38:54PM | BRENT | 68.46 | ‘cess | ||||||||
| 9:42:31PM | GOLD | 1882.81 | 1867 | 1860.5 | 1851 | 1881 | 1887 | 1890 | 1896 | 1877 | |
| 9:45:16PM | FTSE | 7062 | ‘cess | ||||||||
| 9:47:59PM | FRANCE | 6406 | |||||||||
| 9:50:21PM | GERMANY | 15575.29 | |||||||||
| 9:52:41PM | US500 | 4202.97 | ‘cess | ||||||||
| 9:55:15PM | DOW | 34438 | |||||||||
| 10:00:02PM | NASDAQ | 13654.85 | 13346 | 12914.5 | 12521 | 13583 | 13692 | 13714 | 13976 | 13567 | |
| 10:03:38PM | JAPAN | 28496 |
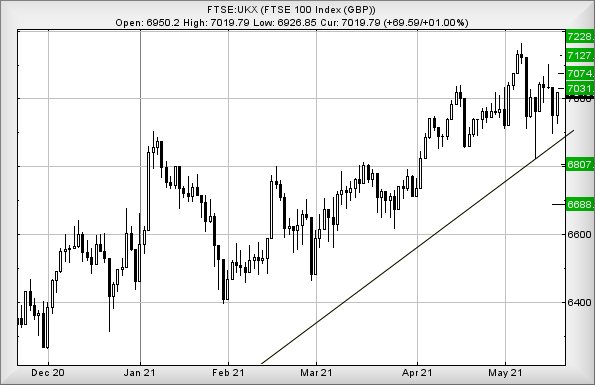
24/05/2021 FTSE Closed at 7051 points. Change of 0.47%. Total value traded through LSE was: £ 3,596,890,836 a change of -36.82%
21/05/2021 FTSE Closed at 7018 points. Change of -0.03%. Total value traded through LSE was: £ 5,693,397,928 a change of 0.83%
20/05/2021 FTSE Closed at 7020 points. Change of 1.01%. Total value traded through LSE was: £ 5,646,307,617 a change of -4.36%
19/05/2021 FTSE Closed at 6950 points. Change of -1.19%. Total value traded through LSE was: £ 5,903,633,845 a change of 15.89%
18/05/2021 FTSE Closed at 7034 points. Change of 0.03%. Total value traded through LSE was: £ 5,094,076,340 a change of 18.05%
17/05/2021 FTSE Closed at 7032 points. Change of -0.16%. Total value traded through LSE was: £ 4,315,305,188 a change of -15.16%
14/05/2021 FTSE Closed at 7043 points. Change of 1.15%. Total value traded through LSE was: £ 5,086,620,345 a change of -7.58%
SUCCESS above means both FAST & SLOW targets were met. ‘CESS means just the FAST target met and probably the next time it is exceeded, movement to the SLOW target shall commence.
Our commentary is in two sections. Immediately below are today’s updated comments. If our commentary remains valid, the share can be found in the bottom section which has a RED heading. Hopefully, this will mean you no longer need to flip back through previous reports. HYPERLINKS DISABLED IN THIS VERSION
Please remember, all prices are mid-price (halfway between the Buy and Sell). When we refer to a price CLOSING above a specific level, we are viewing the point where we can regard a trend as changing. Otherwise, we are simply speculating on near term trading targets. Our website is www.trendsandtargets.com.
UPDATE. We often give an initial and a secondary price. If the initial is exceeded, we still expect it to fall back but the next time the initial is bettered, the price should continue to the secondary. The converse it true with price drops.
We can be contacted at info@trendsandtargets.com. Spam filters set to maximum so only legit emails get through…
Section One – Outlook Updated Today. Click here for Section Two – Outlook Remains Valid shares
Click Epic to jump to share: LSE:BT.A British Telecom** **LSE:EMG MAN** **LSE:FOXT Foxtons** **LSE:GENL Genel** **LSE:HIK Hikma** **LSE:MKS Marks and Spencer** **LSE:NG. National Glug** **LSE:ODX Omega Diags** **LSE:OXIG Oxford Instruments** **LSE:RMG Royal Mail** **LSE:SDY Speedyhire** **LSE:SPX Spirax** **LSE:SRP Serco** **LSE:VEC Vectura** **LSE:ZOO Zoo Digital** **
********
Updated charts published on : British Telecom, MAN, Foxtons, Genel, Hikma, Marks and Spencer, National Glug, Omega Diags, Oxford Instruments, Royal Mail, Speedyhire, Spirax, Serco, Vectura, Zoo Digital,
LSE:BT.A British Telecom. Close Mid-Price: 178 Percentage Change: + 1.19% Day High: 179.1 Day Low: 176.1
Further movement against British Telecom ABOVE 179.1 should improve accel ……..
</p
View Previous British Telecom & Big Picture ***
LSE:EMG MAN. Close Mid-Price: 174.35 Percentage Change: + 0.84% Day High: 175.35 Day Low: 171.55
Target met. All MAN needs are mid-price trades ABOVE 175.35 to improve ac ……..
</p
View Previous MAN & Big Picture ***
LSE:FOXT Foxtons. Close Mid-Price: 58.6 Percentage Change: + 0.69% Day High: 58.4 Day Low: 57.5
Weakness on Foxtons below 57.5 will invariably lead to 50 with secondary ……..
</p
View Previous Foxtons & Big Picture ***
LSE:GENL Genel Close Mid-Price: 141.8 Percentage Change: -1.66% Day High: 143.4 Day Low: 141.6
If Genel experiences continued weakness below 141.6, it will invariably l ……..
</p
View Previous Genel & Big Picture ***
LSE:HIK Hikma. Close Mid-Price: 2490 Percentage Change: + 1.34% Day High: 2485 Day Low: 2460
All Hikma needs are mid-price trades ABOVE 2485 to improve acceleration t ……..
</p
View Previous Hikma & Big Picture ***
LSE:MKS Marks and Spencer. Close Mid-Price: 156.8 Percentage Change: + 2.65% Day High: 156.2 Day Low: 152.5
It’s still the case M&S needs above 164 to bring a visit to an initial 176 ……..
</p
View Previous Marks and Spencer & Big Picture ***
LSE:NG. National Glug. Close Mid-Price: 950.3 Percentage Change: + 0.52% Day High: 956.5 Day Low: 946.8
Further movement against National Glug ABOVE 956.5 should improve acceler ……..
</p
View Previous National Glug & Big Picture ***
LSE:ODX Omega Diags Close Mid-Price: 63.5 Percentage Change: -5.93% Day High: 67.5 Day Low: 63.5
Continued weakness against ODX taking the price below 63.5 calculates as ……..
</p
View Previous Omega Diags & Big Picture ***
LSE:OXIG Oxford Instruments. Close Mid-Price: 2040 Percentage Change: + 0.00% Day High: 2135 Day Low: 1998
In theory, next time this makes it above 2135, the price should head for a ……..
</p
View Previous Oxford Instruments & Big Picture ***
LSE:RMG Royal Mail. Close Mid-Price: 550 Percentage Change: + 4.48% Day High: 553.8 Day Low: 524.4
All Royal Mail needs are mid-price trades ABOVE 553.8 to improve accelera ……..
</p
View Previous Royal Mail & Big Picture ***
LSE:SDY Speedyhire. Close Mid-Price: 81 Percentage Change: + 6.58% Day High: 80.3 Day Low: 76.2
Target met. Continued trades against SDY with a mid-price ABOVE 80.3 shou ……..
</p
View Previous Speedyhire & Big Picture ***
LSE:SPX Spirax. Close Mid-Price: 12425 Percentage Change: + 1.43% Day High: 12425 Day Low: 12250
In the event of Spirax enjoying further trades beyond 12425, the share sh ……..
</p
View Previous Spirax & Big Picture ***
LSE:SRP Serco. Close Mid-Price: 136.1 Percentage Change: + 0.67% Day High: 136.9 Day Low: 134
Below 132 now looks troubling, allowing reversals to an initial 124 with s ……..
</p
View Previous Serco & Big Picture ***
LSE:VEC Vectura. Close Mid-Price: 122.4 Percentage Change: + 0.82% Day High: 123.6 Day Low: 119.8
Target met. Further movement against Vectura ABOVE 123.6 should improve a ……..
</p
View Previous Vectura & Big Picture ***
LSE:ZOO Zoo Digital. Close Mid-Price: 137.5 Percentage Change: + 8.27% Day High: 138.5 Day Low: 127
Target met. In the event of Zoo Digital enjoying further trades beyond 13 ……..
</p
View Previous Zoo Digital & Big Picture ***