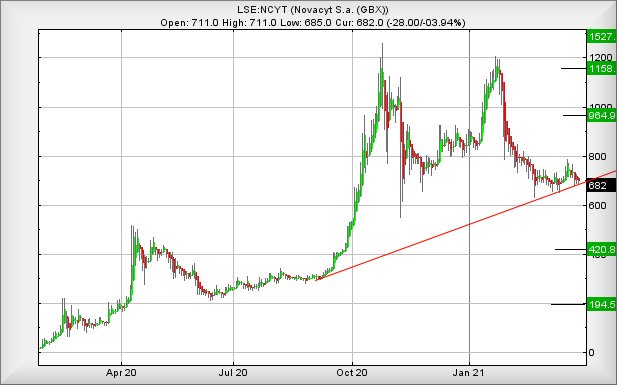
#GoldFutures #DowFutures We reviewed Novacyt over a year ago, before Covid-19 was known to be the thing it is. On the chart, we’d given a potential high of 299p, not for a moment expecting it’d be true and ultimately utterly eclipsed during the ensuing year. It’s probably safe to say their testing kits are proving game changing for the company (and investor) fortunes as the price entered Buzz Lightyear territory (Infinity and Beyond!) when it achieved 1260p last October.
The months since the high have seen the price ‘hesitate’, literally halving in value and scaring the pants off investors. Despite the share recovering to almost the level of the previous high, we’re a little cautious as the price both failed to close above the highest closing price (1190p vs 1194p) nor did it trade above its prior highest intraday price (1206p vs 1260p). Neither of these statistics give confidence, both movements failing to achieve the desired “Higher Highs” so loved by analysts. From our own perspective, there was a 3rd issue as we calculated the potential of 1236p as a high for January this year. Instead, the share price only achieved 1206p, then dropped like a cliche.
As we’re able to prove three points of weakness, we feel it wisest to examine scenario capable of provoking reversals. Below 630p looks the most obvious early warning and with the price trading around 682p at time of writing, the share does not need work hard to cause alarm. Trading below 630p looks capable of triggering reversals to an initial 420p with secondary, if broken, at an ultimate bottom of 194p. To be honest, we do not trust these numbers for several reasons.
Firstly, the plethora of “If you want in, you’re getting a test” situations shouldn’t surprise and it’s unlikely this situation shall ease. We suspect quite the converse shall prove true. In addition, last January Novacyt reports a 20 fold increase in revenue in what was described as a transformational year. Neither statement exactly screams caution for share price movements against one of the leading companies providing testing kits.
When we review their share price movements since the start of February, it looks clear the company need only trade above 830p to again become interesting. In such a scenario, we’re calculating the potential of recovery to an initial 967p with secondary, if bettered, at a fairly noncommittal 1158p. Our secondary comes with an important caveat. Should such a rise be powered by positive news flow for the company, the share could easily accelerate to 1527p.
FUTURES
| Time Issued | Market | Price At Issue | Short Entry | Fast Exit | Slow Exit | Stop | Long Entry | Fast Exit | Slow Exit | Stop | Prior |
| 10:52:56PM | BRENT | 65.17 | Success | ||||||||
| 10:56:24PM | GOLD | 1712.47 | 1705 | 1699.5 | 1681 | 1725 | 1726 | 1733 | 1742 | 1721 | Success |
| 10:58:30PM | FTSE | 6773 | |||||||||
| 11:00:28PM | FRANCE | 6031 | |||||||||
| 11:03:04PM | GERMANY | 14879 | |||||||||
| 11:05:11PM | US500 | 3976.22 | |||||||||
| 11:07:04PM | DOW | 33210 | 32864 | 32715.5 | 32534 | 32988 | 33261 | 33291 | 33352 | 33080 | |
| 11:08:30PM | NASDAQ | 12988 | |||||||||
| 11:10:43PM | JAPAN | 29361 |
29/03/2021 FTSE Closed at 6736 points. Change of -0.06%. Total value traded through LSE was: £ 5,069,344,780 a change of -13.54%
26/03/2021 FTSE Closed at 6740 points. Change of 0.99%. Total value traded through LSE was: £ 5,863,243,404 a change of -5.15%
25/03/2021 FTSE Closed at 6674 points. Change of -0.57%. Total value traded through LSE was: £ 6,181,901,218 a change of 0.02%
24/03/2021 FTSE Closed at 6712 points. Change of 0.19%. Total value traded through LSE was: £ 6,180,734,714 a change of -2.58%
23/03/2021 FTSE Closed at 6699 points. Change of -0.4%. Total value traded through LSE was: £ 6,344,120,262 a change of 9.46%
22/03/2021 FTSE Closed at 6726 points. Change of 0.27%. Total value traded through LSE was: £ 5,795,599,482 a change of -59.88%
19/03/2021 FTSE Closed at 6708 points. Change of -1.05%. Total value traded through LSE was: £ 14,446,904,194 a change of 140.91%
SUCCESS above means both FAST & SLOW targets were met. ‘CESS means just the FAST target met and probably the next time it is exceeded, movement to the SLOW target shall commence.
Our commentary is in two sections. Immediately below are today’s updated comments. If our commentary remains valid, the share can be found in the bottom section which has a RED heading. Hopefully, this will mean you no longer need to flip back through previous reports. HYPERLINKS DISABLED IN THIS VERSION
Please remember, all prices are mid-price (halfway between the Buy and Sell). When we refer to a price CLOSING above a specific level, we are viewing the point where we can regard a trend as changing. Otherwise, we are simply speculating on near term trading targets. Our website is www.trendsandtargets.com.
UPDATE. We often give an initial and a secondary price. If the initial is exceeded, we still expect it to fall back but the next time the initial is bettered, the price should continue to the secondary. The converse it true with price drops.
We can be contacted at info@trendsandtargets.com. Spam filters set to maximum so only legit emails get through…
Section One – Outlook Updated Today. Click here for Section Two – Outlook Remains Valid shares
The Arrow icons refer to expected Big Picture direction. No Arrow, No clue!
Click Epic to jump to share: LSE:BBY BALFOUR BEATTY** **LSE:DDDD 4D Pharma** **LSE:FOXT Foxtons** **LSE:IQE IQE** **LSE:LLOY Lloyds Grp.** **LSE:PPC President Energy** **LSE:SPX Spirax** **LSE:ZOL Zoldav** **
********
Updated charts published on : BALFOUR BEATTY, 4D Pharma, Foxtons, IQE, Lloyds Grp., President Energy, Spirax, Zoldav,
LSE:BBYLSE:BBY BALFOUR BEATTY. Close Mid-Price: 301.2 Percentage Change: + 0.07% Day High: 305 Day Low: 298.4
Target met. In the event of BALFOUR BEATTY enjoying further trades beyond ……..
</p
View Previous BALFOUR BEATTY & Big Picture ***
LSE:DDDD 4D Pharma Close Mid-Price: 110.5 Percentage Change: -3.49% Day High: 115 Day Low: 108.5
This is getting dodgy as weakness below 108 looks very capable of hitting ……..
</p
View Previous 4D Pharma & Big Picture ***
LSE:FOXTLSE:FOXT Foxtons. Close Mid-Price: 62 Percentage Change: + 1.64% Day High: 62.6 Day Low: 58.8
Even below 57 would now cause alarm, calculating with weakness to an initi ……..
</p
View Previous Foxtons & Big Picture ***
LSE:IQELSE:IQE IQE. Close Mid-Price: 61.4 Percentage Change: + 8.77% Day High: 62.45 Day Low: 54.75
If IQE experiences continued weakness below 54.75, it will invariably lea ……..
</p
View Previous IQE & Big Picture ***
LSE:LLOY Lloyds Grp. Close Mid-Price: 42.06 Percentage Change: -0.46% Day High: 42.47 Day Low: 41.76
All Lloyds Grp. needs are mid-price trades ABOVE 42.47 to improve acceler ……..
</p
View Previous Lloyds Grp. & Big Picture ***
LSE:PPC President Energy Close Mid-Price: 2 Percentage Change: -2.44% Day High: 2.05 Day Low: 1.98
In the event President Energy experiences weakness below 1.98 it calculat ……..
</p
View Previous President Energy & Big Picture ***
LSE:SPX Spirax Close Mid-Price: 11410 Percentage Change: -0.78% Day High: 11605 Day Low: 11325
This has effectively fallen asleep for the last few months, failing to sho ……..
</p
View Previous Spirax & Big Picture ***
LSE:ZOL Zoldav Close Mid-Price: 29.5 Percentage Change: -4.84% Day High: 31 Day Low: 29.5
Continued weakness against ZOL taking the price below 29.5 calculates as ……..
</p
View Previous Zoldav & Big Picture ***