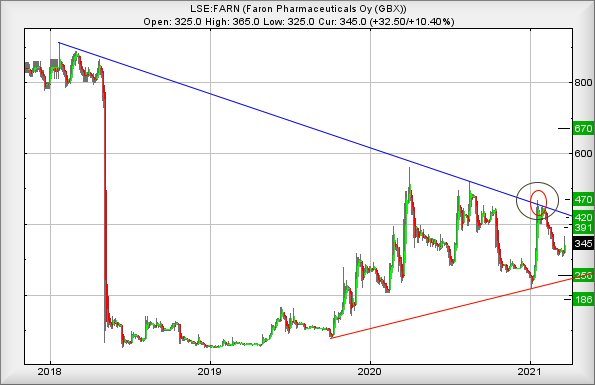
#Gold #Nasdaq The last year has not been kind to drug pusher, Faron. The Finnish cancer drug specialist has seen their price oscillate between 520p and 220p since our previous report but astonishingly, the share has remained firmly trapped between two trends, despite this bandwidth of movement. We’re a little bit encouraged by a single “blip” in price moves in January of this year (circled) as this might actually mean something.
Often, when we witness this sort of thing, usually it’s an uptrend momentarily broken, we prefer regard it as an early warning signal, one telling us ‘The Trend Can Break – Caution Advised’. Roughly 2/3rd of the time, this caution proves justified. The converse, thankfully, can prove true, when a downtrend experiences a momentary break. In the case of Faron, the Blue downtrend line was confirmed yet again and may perhaps merit some close examination in the weeks ahead.
The current price movement prospects look fairly interesting. Presently trading around 345p, the share need only exceed 365p as recovery toward an initial 391p calculates as possible. If exceeded, our longer term (or the next day!) secondary works out at 420p, along with yet another challenge of the Blue downtrend. Importantly though, if such a movement is being propelled by positive sentiment, the share price could easily continue upward to a surprising 470p.
Obviously such an ambition gives the share price a chance to actually close above the major Blue downtrend. Despite historical hesitation around the 470p level, we quite strongly suspect this scenario shall prove game changing for the longer term. To cut a long story short, above 470p gives an amazing calculation which points to 670p eventually!
For everything to go wrong, Faron Pharma needs fall below 310p to justify raised eyebrows as this threatens reversal to an initial 256p with secondary, if broken, a frightening 186p. It’s important to mention we cannot calculate any targets below the 186p, always a scary sentence to write. However, despite the companies shambolic price drop in 2018, the share has always avoided hitting major drop targets, making us conclude there is embedded strength in the company.
This is one we feel worth keeping an eye on.
FUTURES
| Time Issued | Market | Price At Issue | Short Entry | Fast Exit | Slow Exit | Stop | Long Entry | Fast Exit | Slow Exit | Stop | Prior |
| 9:52:06PM | BRENT | 64.25 | |||||||||
| 9:53:54PM | GOLD | 1739.28 | 1727 | 1720.5 | 1713 | 1737 | 1743 | 1747.5 | 1754 | 1730 | |
| 9:55:56PM | FTSE | 6715.5 | ‘cess | ||||||||
| 9:58:07PM | FRANCE | 5962 | Success | ||||||||
| 10:02:18PM | GERMANY | 14659 | ‘cess | ||||||||
| 10:04:54PM | US500 | 3943.02 | ‘cess | ||||||||
| 10:07:33PM | DOW | 32771 | |||||||||
| 10:09:45PM | NASDAQ | 13091 | 12880 | 12814 | 12692 | 12992 | 13180 | 13258.5 | 13446 | 13003 | Success |
| 10:11:47PM | JAPAN | 29260 | ‘cess |
22/03/2021 FTSE Closed at 6726 points. Change of 0.27%. Total value traded through LSE was: £ 5,795,599,482 a change of -59.88%
19/03/2021 FTSE Closed at 6708 points. Change of -1.05%. Total value traded through LSE was: £ 14,446,904,194 a change of 140.91%
18/03/2021 FTSE Closed at 6779 points. Change of 0.25%. Total value traded through LSE was: £ 5,996,916,137 a change of -9.18%
17/03/2021 FTSE Closed at 6762 points. Change of -0.6%. Total value traded through LSE was: £ 6,602,740,362 a change of -14.86%
16/03/2021 FTSE Closed at 6803 points. Change of 0.8%. Total value traded through LSE was: £ 7,754,900,384 a change of 34.17%
15/03/2021 FTSE Closed at 6749 points. Change of -0.18%. Total value traded through LSE was: £ 5,779,699,069 a change of 6.67%
12/03/2021 FTSE Closed at 6761 points. Change of 0.37%. Total value traded through LSE was: £ 5,418,064,712 a change of -9.29%
SUCCESS above means both FAST & SLOW targets were met. ‘CESS means just the FAST target met and probably the next time it is exceeded, movement to the SLOW target shall commence.
Our commentary is in two sections. Immediately below are today’s updated comments. If our commentary remains valid, the share can be found in the bottom section which has a RED heading. Hopefully, this will mean you no longer need to flip back through previous reports. HYPERLINKS DISABLED IN THIS VERSION
Please remember, all prices are mid-price (halfway between the Buy and Sell). When we refer to a price CLOSING above a specific level, we are viewing the point where we can regard a trend as changing. Otherwise, we are simply speculating on near term trading targets. Our website is www.trendsandtargets.com.
UPDATE. We often give an initial and a secondary price. If the initial is exceeded, we still expect it to fall back but the next time the initial is bettered, the price should continue to the secondary. The converse it true with price drops.
We can be contacted at info@trendsandtargets.com. Spam filters set to maximum so only legit emails get through…
Section One – Outlook Updated Today. Click here for Section Two – Outlook Remains Valid shares
The Arrow icons refer to expected Big Picture direction. No Arrow, No clue!
Click Epic to jump to share: LSE:BBY BALFOUR BEATTY** **LSE:BDEV Barrett Devs** **LSE:CBX Cellular Goods** **LSE:GLEN Glencore Xstra** **LSE:NWG Natwest** **LSE:POG Petrop etc** **LSE:TAN Tanfield** **
********
Updated charts published on : BALFOUR BEATTY, Barrett Devs, Cellular Goods, Glencore Xstra, Natwest, Petrop etc, Tanfield,
LSE:BBYLSE:BBY BALFOUR BEATTY. Close Mid-Price: 298.2 Percentage Change: + 0.07% Day High: 302.6 Day Low: 296.4
Further movement against BALFOUR BEATTY ABOVE 302.6 should improve accele ……..
</p
View Previous BALFOUR BEATTY & Big Picture ***
LSE:BDEV Barrett Devs Close Mid-Price: 763.4 Percentage Change: -0.86% Day High: 776.4 Day Low: 756.6
Continued trades against BDEV with a mid-price ABOVE 776.4 should improve ……..
</p
View Previous Barrett Devs & Big Picture ***
LSE:CBX Cellular Goods Close Mid-Price: 10.6 Percentage Change: -0.93% Day High: 10.88 Day Low: 10.25
Added out of curiousity, thanks to my personal fascination with US & Canad ……..
</p
View Previous Cellular Goods & Big Picture ***
LSE:GLEN Glencore Xstra Close Mid-Price: 279.45 Percentage Change: -0.90% Day High: 283.6 Day Low: 276.6
Below 275 is looking slightly problematic, allowing weakness to an initial ……..
</p
View Previous Glencore Xstra & Big Picture ***
LSE:NWGLSE:NWG Natwest. Close Mid-Price: 194.35 Percentage Change: + 1.54% Day High: 198.35 Day Low: 191
All Natwest needs are mid-price trades ABOVE 198.35 to improve accelerati ……..
</p
View Previous Natwest & Big Picture ***
LSE:POG Petrop etc Close Mid-Price: 25.25 Percentage Change: -3.07% Day High: 26.1 Day Low: 25.3
If Petrop etc experiences continued weakness below 25.3, it will invariab ……..
</p
View Previous Petrop etc & Big Picture ***
LSE:TAN Tanfield Close Mid-Price: 2.63 Percentage Change: -1.13% Day High: 2.8 Day Low: 2.74
When discussing useless, one of the better candidates is Tanfield share pr ……..
</p
View Previous Tanfield & Big Picture ***