FTSE for FRIDAY 11/12/2020

FTSE for FRIDAY (FTSE:UKX) Last Friday again provided a clue why our glance at the UK100 market is so popular, literally worldwide. We’d given criteria for a modest 55 point rise on the FTSE, calculating a secondary target at 6,560 points (link). On Friday, the FTSE topped out at 6,559.18 points, almost exactly our ambition and once again proving there’s a little bit more than guesswork going on!

Unusually, we also mentioned a 3rd target for the FTSE at 6,611 points, this being successfully achieved on Wednesday when the index achieved a day high of 6,623. It certainly feels, at least until such time our Govt foul up Brexit negotiations or Covid-19 immunisations, a Santa Rally is taking place. This being the case, some considerable hope is available for further market movements upward, though we’ve understandable hesitation with Big Picture ambitions. Surely UK politicians shall discover some method of derailing the potential of a 600 point rise cycle?

Near term, we calculate movement above 6,641 points as being capable of an initial 6,697 points. This target level is quite interesting as we’ve currently 3 distinctly different scenario establishing this as a viable target level. Usually we’re more than happy when 2 scenario agree, thus confidence appears possible. If exceeded, our secondary works out at 6,747 points.

From a bigger picture viewpoint, the FTSE has finally above the 6,500 level, a painfully obvious glass ceiling. Longer term, we can now mention 7,081 with secondary 7,310 as quite strong recovery prospects. It’s definitely “fingers crossed time” as London would need reverse below 6,074 to justify hysterics. In the absence of strong political will attempting to damage the markets, confidence appears possible.
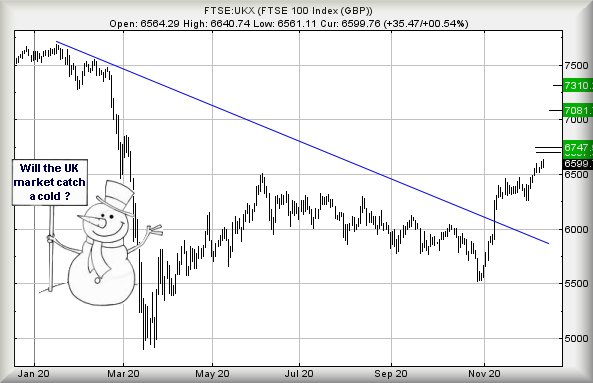
Hey, chart goes here

FUTURES

Time Issued Market Price At Issue Short Entry Fast Exit Slow Exit Stop Long Entry Fast Exit Slow Exit Stop Prior
10:24:06PM BRENT 50.36 48.81 48.41 49.7 50.99 51.13 49.5 ‘cess
10:26:24PM GOLD 1837 1828 1817.5 1850 1853 1863.5 1833
10:45:32PM FTSE 6602 6557 6549.5 6602 6617 6641.5 6583 ‘cess
10:48:13PM FRANCE 5540 5507 5491.5 5550 5571 5588 5531
10:51:35PM GERMANY 13299 13259 13194 13325 13370 13394 13280 ‘cess
10:53:53PM US500 3669 3655 3638.5 3678 3684 3699.5 3657 ‘cess
10:56:42PM DOW 30040 29936 29868 30066 30130 30162 30019 ‘cess
10:59:00PM NASDAQ 12402 12220 12147 12380 12448 12460.5 12348 ‘cess
11:01:14PM JAPAN 26688 26606 26537 26753 26831 26893.5 26670 ‘cess
10/12/2020 FTSE Closed at 6599 points. Change of 0.53%. Total value traded through LSE was: £ 7,239,162,237 a change of 27.24%
9/12/2020 FTSE Closed at 6564 points. Change of 0.09%. Total value traded through LSE was: £ 5,689,395,466 a change of 1.75%
8/12/2020 FTSE Closed at 6558 points. Change of 0.05%. Total value traded through LSE was: £ 5,591,373,092 a change of -5.03%
7/12/2020 FTSE Closed at 6555 points. Change of 0.08%. Total value traded through LSE was: £ 5,887,798,366 a change of -14.07%
4/12/2020 FTSE Closed at 6550 points. Change of 0.92%. Total value traded through LSE was: £ 6,852,193,326 a change of -2.58%
3/12/2020 FTSE Closed at 6490 points. Change of 0.42%. Total value traded through LSE was: £ 7,033,541,138 a change of 11.37%
2/12/2020 FTSE Closed at 6463 points. Change of 1.24%. Total value traded through LSE was: £ 6,315,459,569 a change of 10.4%

Brent Crude & SThree too 10/12/2020

#DAX #NASDAQ We’d planned to focus on Brent alone but an email, rather plaintively, asked us to take a quick look at #SThree PLC, essentially a recruitment agency with a bunch of well known brands in its stable. The exercise turned into a prime example of “easily distracted”, thanks to not coming across the share before with the result we decided to feature both shares in this, our Trends and Targets headline section.


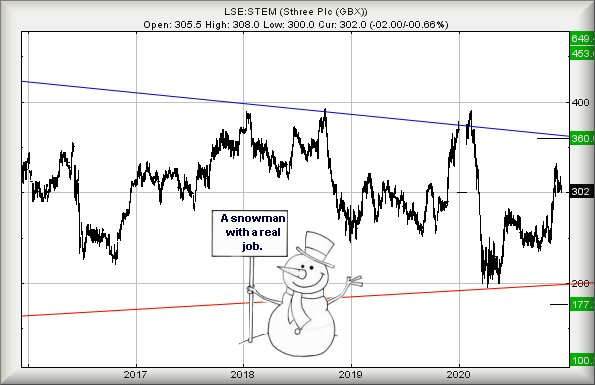
SThree , presently trading around 302p, is quite surprising. At first glance, it’s easy to dismiss the share as floundering around but given it’s doing so within an impressive trading range (2 quid to 4 quid) and has been in this hiatus since 2015, it provides a fairly safe haven. Except, of course, for the folk who bought at 4 quid and those who opened a short at £2. The immediate cycle is fairly interesting, allowing us to present a couple of scenario.

In the event the share manages above 333p, it looks capable of triggering further recovery toward an initial 360p, a point at which the share price intercepts the 13 year old Blue downtrend. We’d obviously suspect some hesitation at this level but critically, if the company manages to actually close a day above 360p, there’s a pretty strong argument favouring an upward break in the direction of 453p. This sort of thing is liable to prove game changing for the longer term, thanks to the allure of 649p as a Big Picture ambition.

Alternately, and doubtless less likely if the Covid-19 thing resolves itself, will be the danger implied if the price manages to weaken below 235p for any reason. A movement such is this is liable to prove traumatic, allowing reversal to 177p (again, breaking the rangebound situation) with secondary, if broken, at 100p.

Hey, chart goes here

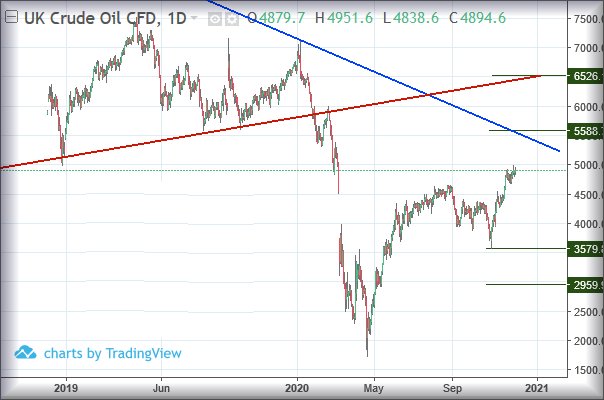
Brent Crude Brent is proving frustrating, thanks to a problem with the numbers. For some considerable time, we’ve been calculating the $50 level as a ‘problem area’ for the price of UK Crude and the barrel price has avoided tampering with this price, movements in December remaining carefully below the $50 mark. When this sort of thing happens, it’s generally quite easy to assume a trigger level exists, one which the market is carefully avoiding.

We suspect this shall prove the case.

Movement next above $50 (or if playing utterly safe, $51.5 thanks to some ambiguous price shuffles) looks very capable of commencing price recovery to an initial $55.88 with secondary, if exceeded, calculating at a more impressive $65.26. The surprising feature with both target levels comes from the proximity of the long term downtrend and uptrend. Achieving $55.88 would certainly challenge the Blue line on the chart. Achieving $65.26 would imply a coming attempt for the barrel price to regain its historical uptrend, a truly amazing feat.

For things to go horribly wrong for Brent Crude, the price needs drip below the $42 level as reversal to the $29 mark looks very possible.

Hey, chart goes here


FUTURES

Time Issued Market Price At Issue Short Entry Fast Exit Slow Exit Stop Long Entry Fast Exit Slow Exit Stop Prior
9:47:59PM BRENT 49.02 ‘cess
9:50:00PM GOLD 1839.47
9:55:12PM FTSE 6577 Success
9:57:29PM FRANCE 5554.4 ‘cess
10:00:03PM GERMANY 13345 13279 13242 13171 13353 13455 13483.25 13530 13363 Success
10:02:35PM US500 3671.27 ‘cess
10:04:45PM DOW 30064 Shambles
10:08:07PM NASDAQ 12356 12307 12235 12208 12457 12510 12553 12636 12413 Success
10:09:44PM JAPAN 26681 Success
9/12/2020 FTSE Closed at 6564 points. Change of 0.09%. Total value traded through LSE was: £ 5,689,395,466 a change of 1.75%
8/12/2020 FTSE Closed at 6558 points. Change of 0.05%. Total value traded through LSE was: £ 5,591,373,092 a change of -5.03%
7/12/2020 FTSE Closed at 6555 points. Change of 0.08%. Total value traded through LSE was: £ 5,887,798,366 a change of -14.07%
4/12/2020 FTSE Closed at 6550 points. Change of 0.92%. Total value traded through LSE was: £ 6,852,193,326 a change of -2.58%
3/12/2020 FTSE Closed at 6490 points. Change of 0.42%. Total value traded through LSE was: £ 7,033,541,138 a change of 11.37%
2/12/2020 FTSE Closed at 6463 points. Change of 1.24%. Total value traded through LSE was: £ 6,315,459,569 a change of 10.4%
1/12/2020 FTSE Closed at 6384 points. Change of 1.88%. Total value traded through LSE was: £ 5,720,343,712 a change of -42.77%

BHP Plc (LSE:BHP) for 9/12/2020

#CAC40 #WallSt  Sometimes the temptation to do a little research on a company can drag you down a rabbit hole. A desire to discover the words behind the letters, BHP Group Plc (Broken Hill Proprietary) revealed a company, formed in 1885, with a fascinating history. It was funny, an assumption the mob were originally South African, came from their previous name, BHP Billiton and stupid logic the naming convention was related to the best thing to come out of South Africa, Biltong.

Obviously, this shocking discovery demanded more research, in the process discovering the Billiton part of the name came from another, older, company working on Belitung, an island off the coast of Sumatra.

Long (very long) story short, by 2017 BHP could claim to be the largest mining company in the world, based on their market capitalisation alone. And they’ve never had anything to do with a dried beef treat from South Africa!


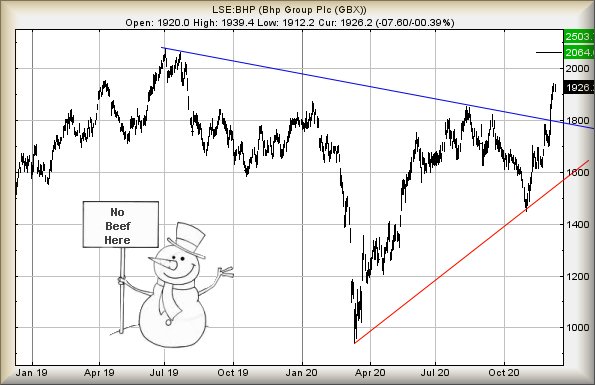
Similar to every other share, BHP received a similar hammering in March, thanks to Covid-19. In the period since, the share has more than doubled in value and now, is trading higher than before the Covid-19 drop. From our perspective, this is a good sight and promises more for the future. The immediate picture is fairly interesting, suggesting movement beyond 1942p should make an attempt at an initial 2064p, challenging the historical highs from last year (2019). This is liable to prove significant as closure above 2064p calculates as game changing for the longer term with 2503p making a lot of sense as a future ambition.

Above such a level, we’d need revisit the tea leaves but for now, BHP appear to be inspiring some confidence. The share price would need break Red on the chart, currently 1570p, to justify buying running shoes. Even any return below Blue at 1800p would suggest raising an eyebrow in concern.

Hey, chart goes here


FUTURES

Time Issued Market Price At Issue Short Entry Fast Exit Slow Exit Stop Long Entry Fast Exit Slow Exit Stop Prior
9:56:05PM BRENT 48.83 ‘cess
9:57:29PM GOLD 1870.89
9:59:10PM FTSE 6573
10:00:32PM FRANCE 5575.7 5519 5504.5 5480 5562 5579 5595.5 5621 5539 ‘cess
10:07:26PM GERMANY 13315 ‘cess
10:09:21PM US500 3703.47 ‘cess
10:31:35PM DOW 30185 29862 29785 29632 30061 30244 30328.5 30484 30102 ‘cess
10:33:33PM NASDAQ 12648 ‘cess
10:35:29PM JAPAN 26516
8/12/2020 FTSE Closed at 6558 points. Change of 0.05%. Total value traded through LSE was: £ 5,591,373,092 a change of -5.03%
7/12/2020 FTSE Closed at 6555 points. Change of 0.08%. Total value traded through LSE was: £ 5,887,798,366 a change of -14.07%
4/12/2020 FTSE Closed at 6550 points. Change of 0.92%. Total value traded through LSE was: £ 6,852,193,326 a change of -2.58%
3/12/2020 FTSE Closed at 6490 points. Change of 0.42%. Total value traded through LSE was: £ 7,033,541,138 a change of 11.37%
2/12/2020 FTSE Closed at 6463 points. Change of 1.24%. Total value traded through LSE was: £ 6,315,459,569 a change of 10.4%
1/12/2020 FTSE Closed at 6384 points. Change of 1.88%. Total value traded through LSE was: £ 5,720,343,712 a change of -42.77%
30/11/2020 FTSE Closed at 6266 points. Change of -1.59%. Total value traded through LSE was: £ 9,995,620,767 a change of -0.31%

GBP vs EURO (FX:GBPEUR) 8/12/2020

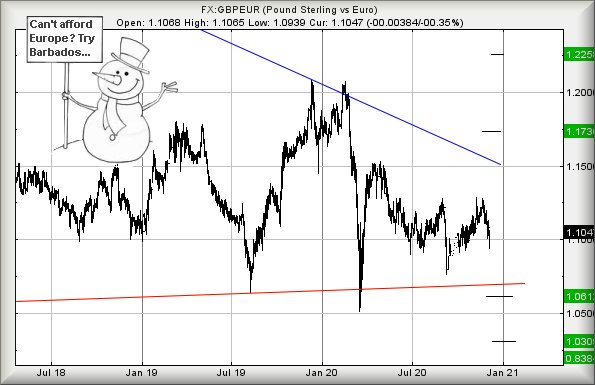
#Gold #SP500 We’ve been receiving emails about Deal Or No Deal, better known as the Brexit negotiations. Apparently, depending on the outcome of the talking shop, GBPEUR is expected to move sharply but we wonder, quite seriously, just what the market will believe to be a good outcome. Since April, the pairing has been pretty rangebound, spending most of its time hovering between 1.10 and 1.15, doubtless in response to whatever spin the media place of the latest gossip.

We’re inclined to assign some importance to a rate of 1.090. Movement below such a level now looks very liable to trigger weakness in the direction of an initial 1.061. If broken, our secondary calculates at 1.030 and hopefully a bounce.

There’s a pretty serious problem, if this relationship discovers sufficient excuse to weaken below 1.030 as longer term, reversal toward an eventual bottom of 0.838 is liable to commence. Obviously there’s a mantra, almost graven in rock, of parity between the Euro and Sterling being “bottom” for this pairing but unfortunately, when we review the big picture there’s absolutely no reason to expect 1:1 shall provide a realistic rebound. Quite the converse in fact!


Some slight hope is being taken from the Glass Ceiling which formed since June of this year. For reasons known only to the Forex market, considerable effort has been employed to stop the relationship strengthening with a CLOSING PRICE above 1.1274. If we chose to play safe and declare intraday trades above 1.13 will suggest a coming change in the fortunes of Sterling, above 1.13 looks very capable of triggering recovery to an initial 1.173 with secondary, if exceeded, calculating at a more useful 1.225.

For the present, we don’t think the market has a clue what to do and this will doubtless make movement (on the release of factual news) very sharp and very fast.

Hey, chart goes here

FUTURES

Time Issued Market Price At Issue Short Entry Fast Exit Slow Exit Stop Long Entry Fast Exit Slow Exit Stop Prior
10:10:38PM BRENT 48.67 ‘cess
10:13:40PM GOLD 1862 1821 1808.5 1789 1843 1869 1882.5 1922 1828 ‘cess
10:15:43PM FTSE 6524 ‘cess
10:17:42PM FRANCE 5564 ‘cess
10:20:45PM GERMANY 13250 ‘cess
10:28:16PM US500 3683 3672 3667.5 3655 3689 3697 3703.5 3714 3681
10:32:04PM DOW 30015
10:34:46PM NASDAQ 12574 Success
10:37:18PM JAPAN 26338


7/12/2020 FTSE Closed at 6555 points. Change of 0.08%. Total value traded through LSE was: £ 5,887,798,366 a change of -14.07%
4/12/2020 FTSE Closed at 6550 points. Change of 0.92%. Total value traded through LSE was: £ 6,852,193,326 a change of -2.58%
3/12/2020 FTSE Closed at 6490 points. Change of 0.42%. Total value traded through LSE was: £ 7,033,541,138 a change of 11.37%
2/12/2020 FTSE Closed at 6463 points. Change of 1.24%. Total value traded through LSE was: £ 6,315,459,569 a change of 10.4%
1/12/2020 FTSE Closed at 6384 points. Change of 1.88%. Total value traded through LSE was: £ 5,720,343,712 a change of -42.77%
30/11/2020 FTSE Closed at 6266 points. Change of -1.59%. Total value traded through LSE was: £ 9,995,620,767 a change of -0.31%
27/11/2020 FTSE Closed at 6367 points. Change of 0.08%. Total value traded through LSE was: £ 10,026,664,770 a change of 117.2%

Lloyds Bank for 7/12/2020

#Brent #SP500 Here in our part of Scotland, sometimes we wake up to amazing views. Friday was one such occasion, snow covered hills, a promise of blue sky, the local shipwreck almost concealed by a high tide. Better still, instead of raining, the sun came out, justifying taking the dogs into the hills to play in the snow (A Golden Retriever thing, almost a law!).

Hey, chart goes here

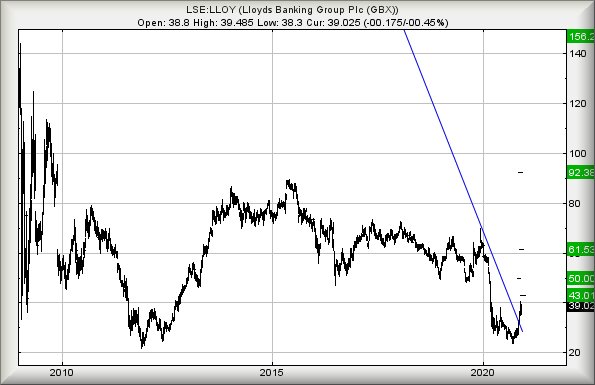
As for Lloyds, for a few minutes early on Friday, the share also looked capable of enjoying a good day with some truly surprising price movements during the first 2 hours. Then, as with so many things on the UK market, enthusiasm waned with the price spending the rest of the day simply going through the motions. Surprisingly, from our perspective, this wasted effort gave some important clues as to where we should calculate the next trigger level and it’s at 39.6p.

We should point out we’re already fairly enthusiastic for Lloyds potentials, thanks to the share price successfully closing above 38p. The marks a “higher high” for the period since the Covid-19 drop in March and from our perspective, this means we should now anticipate the share price over-performing. In plain English, this calculates price gains above 39.6p should bring a fairly boring movement to an initial 40.6p. In this scenario, should Lloyds manage to trade above 40.6p anytime soon, our thoughts lean toward the concept of flamboyant movement and in this case, we should not be surprised if 43p makes an appearance thereafter.

It’s worth pointing out the obvious, expecting a retail bank share to provide a 10% rise in a single day is unlikely unless some important news comes along. However, Lloyds share price is already primed and ready for some useful recovery.

From a Big Picture perspective, we can step back and mention we’re looking for 50p eventually with secondary, with closure above such a level, at a visually sensible 61.5p. For it all to go wrong against Lloyds, the share needs crumble below 31.7p, a pretty reasonable Stop Loss level for those brave enough to take a Long position on a retail bank.

Hey, chart goes here

FUTURES

Time Issued Market Price At Issue Short Entry Fast Exit Slow Exit Stop Long Entry Fast Exit Slow Exit Stop Prior
10:45:02PM BRENT 49.1 48.78 48.56 48.12 49.48 49.86 50.14 50.62 48.8 Success
6:16:52PM GOLD 1839.21 ‘cess
6:22:38PM FTSE 6552.14 Success
6:25:38PM FRANCE 5614.9 ‘cess
6:29:32PM GERMANY 13276
6:35:51PM US500 3690 3668 3656.5 3642 3683 3695 3706.75 3716 3684 ‘cess
6:39:16PM DOW 30155 ‘cess
6:42:50PM NASDAQ 12509
6:45:23PM JAPAN 26813 Shambles


4/12/2020 FTSE Closed at 6550 points. Change of 0.92%. Total value traded through LSE was: £ 6,852,193,326 a change of -2.58%
3/12/2020 FTSE Closed at 6490 points. Change of 0.42%. Total value traded through LSE was: £ 7,033,541,138 a change of 11.37%
2/12/2020 FTSE Closed at 6463 points. Change of 1.24%. Total value traded through LSE was: £ 6,315,459,569 a change of 10.4%
1/12/2020 FTSE Closed at 6384 points. Change of 1.88%. Total value traded through LSE was: £ 5,720,343,712 a change of -42.77%
30/11/2020 FTSE Closed at 6266 points. Change of -1.59%. Total value traded through LSE was: £ 9,995,620,767 a change of -0.31%
27/11/2020 FTSE Closed at 6367 points. Change of 0.08%. Total value traded through LSE was: £ 10,026,664,770 a change of 117.2%
26/11/2020 FTSE Closed at 6362 points. Change of -0.45%. Total value traded through LSE was: £ 4,616,288,955 a change of -37.01%

FTSE for FRIDAY for 4/12/2020

#FTSE #GOLD At Trends and Targets, we’re often asked how we produce our target levels, hopefully due to our often devastating accuracy. For commercial reasons, we’re forced to be vague but there’s another reality in play. Very rarely do we apply just one set of formula to a potential movement. Instead, we’ll look at near term potentials based on market movements during the most recent month. Then we’ll zoom out and look at what’s been happening during the period since the last cataclysm (think Covid-19 hitting), and finally take a glance at really big picture potentials, sometimes since the beginning of time. As part of this exercise, we question if a price is trading higher (or lower) than any previous highs, along with looking for visual cues on a chart.

At this point, beside boring the reader, there’s another factor which requires satisfied. We’ve got to question whether recent minute by minute movements are tending to reach targets or fizzle out, before target levels are achieved. This is an attempt to ascertain whether a market is showing any particular strength, in any particular direction.

Sometimes, the result of all this focus on numbers is a need to just walk away and admit we don’t have a blooming clue! Other times, such as with the FTSE at present, we start to find hints of direction and will bias our thinking accordingly.


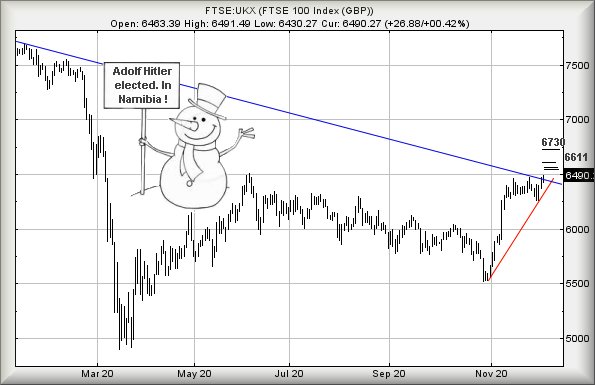
In this report, the bias is toward potential gains on the UK market, at least until 6730 makes a guest appearance. At such a level, we believe the FTSE may pause for breath, especially as our next major point of interest is around 600 points higher.


For the immediate future, our inclination is to “play it safe” with the FTSE, demanding the index next trade above 6505 points to enter a cycle toward an initial 6543 points. If exceeded, our secondary calculates at 6560 points. In fact, the index could easily find itself accelerating toward 6611 points.

If triggered, the tightest stop loss level looks like a reasonable 6450 points. It’s fingers crossed time, especially as the market now needs below 6383 to suggest our optimism is misplaced.


Hey, chart goes here

FUTURES

Time Issued Market Price At Issue Short Entry Fast Exit Slow Exit Stop Long Entry Fast Exit Slow Exit Stop Prior
10:27:20PM BRENT 48.79 47.64 47.265 48.45 48.84 48.96 48.14 Sorry
10:28:46PM GOLD 1841.32 1823 1815.5 1838 1844 1847 1834 ‘cess
10:31:25PM FTSE 6489.77 6421 6394 6479 6512 6546 6450 ‘cess
10:32:57PM FRANCE 5549.9 5542 5529.5 5577 5586 5601.5 5553
10:36:19PM GERMANY 13213.87 13198 13171 13232 13276 13318 13230 Success
10:37:51PM US500 3668 3655 3644.5 3675 3682 3691.5 3664 ‘cess
10:40:35PM DOW 29958 29769 29700.5 29915 30073 30129.5 29951 Success
10:42:03PM NASDAQ 12484 12440 12411 12492 12540 12563 12464
10:43:53PM JAPAN 26733 26672 26620.5 26767 26840 26894 26759


3/12/2020 FTSE Closed at 6490 points. Change of 0.42%. Total value traded through LSE was: £ 7,033,541,138 a change of 11.37%
2/12/2020 FTSE Closed at 6463 points. Change of 1.24%. Total value traded through LSE was: £ 6,315,459,569 a change of 10.4%
1/12/2020 FTSE Closed at 6384 points. Change of 1.88%. Total value traded through LSE was: £ 5,720,343,712 a change of -42.77%
30/11/2020 FTSE Closed at 6266 points. Change of -1.59%. Total value traded through LSE was: £ 9,995,620,767 a change of -0.31%
27/11/2020 FTSE Closed at 6367 points. Change of 0.08%. Total value traded through LSE was: £ 10,026,664,770 a change of 117.2%
26/11/2020 FTSE Closed at 6362 points. Change of -0.45%. Total value traded through LSE was: £ 4,616,288,955 a change of -37.01%
25/11/2020 FTSE Closed at 6391 points. Change of -0.64%. Total value traded through LSE was: £ 7,328,126,643 a change of -3.31%

Hochschild & Rainbow Rare Earths 3/12/2020

#DAX #DOW  A glance at Hochschild area of operations was surprising, the map looking identical to the route taken by Euan McGregor in the recent TV show, The Long Way Up. Essentially, film actor McGregor rode an electric bike up the left hand side of South America, the trip punctuated by constant searches for a travel plug and cable extensions.

Hochschild (LSE:HOC) , describing themselves as the leading underground precious metals producer, search for gold and silver with some really big recovery numbers quoted on their website. With gold prices messing around between the 1800 and 2000 dollar level presently, the company is doubtless enjoying levels of income not seen for 9 years. This detail shall perhaps prove important when we take a look at the immediate share price potentials.

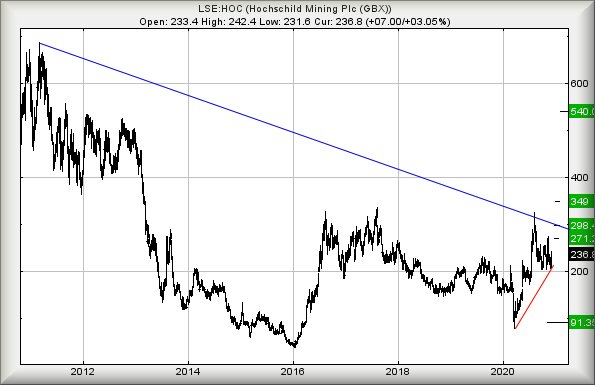
Currently trading around 237p, we regard 247p with the potential of triggering some further recovery. Above this level, we can calculate an initial ambition of 271p with secondary, if bettered, at 298p. Visually, neither aspiration is particularly interesting, especially as the Big Picture demands the share price CLOSE a session above 298p to provoke a return to some historical share price levels.

Closure above 298p should present 349p as a reasonable hope with secondary, if exceeded, calculating at a more useful 540p and a return to levels the share price has not witnessed for 9 years. If it all intends go wrong, the price needs reverse below 200p as this makes swift reversal to 91p an arithmetic possibility.

Hey, chart goes here

Rainbow Rare Earths (LSE:RBW) The rainbow symbol appears to be hijacked by any organisation wishing to present themselves as “a right-on, politically correct bunch”. It was refreshing to visit Rainbow Rare Earths website and discover they’ve carefully avoiding using the cliché anywhere in their presentations, instead opting for a corporate logo of 4 different coloured pointed hats. Perhaps the little hats are supposed to denote a mountain range?

From the corporate website, their business strategy reads as; “… to become a globally significant producer of rare earth metals, with a particular focus on NdPr, a fundamental building block in the global green technology revolution. As a key component of permanent magnets, required in the construction of motors and turbines, analysts are predicting demand for these rare earth oxides to grow substantially over the coming years, tipping into a supply deficit.

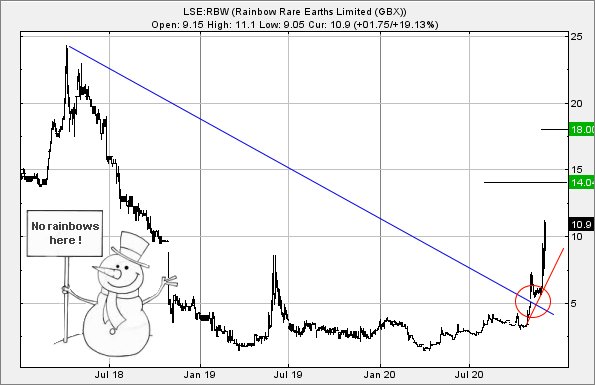
At time of writing, Rainbow are trading around the 11p mark, needing only trades above 11.2p to suggest coming price recovery to an initial 14p with secondary, if bettered, calculating at 18p. If we chose to accept the closing price as a sensible signal, the share already allows considerable optimism for the future.

Presently, the share price needs sink below 6p to provoke panic for the future but we’re fairly impressed at the strength of movement since the start of November and the forced “gap” up in price. The market clearly has an idea of what it wants.


Hey, chart goes here

Time Issued Market Price At Issue Short Entry Fast Exit Slow Exit Stop Long Entry Fast Exit Slow Exit Stop Prior
10:11:59PM BRENT 47.96 ‘cess
10:13:47PM GOLD 1830.95 ‘cess
10:15:50PM FTSE 6452 ‘cess
10:23:01PM FRANCE 5577 ‘cess
10:25:36PM GERMANY 13308 13280 13255 13195 13328 13371 13406 13452 13303 ‘cess
10:27:20PM US500 3670 Shambles
10:30:08PM DOW 29910 26600 29492 29386 29750 29922 29966.5 30089 29755 ‘cess
10:33:27PM NASDAQ 12466
10:48:30PM JAPAN 26851 ‘cess


2/12/2020 FTSE Closed at 6463 points. Change of 1.24%. Total value traded through LSE was: £ 6,315,459,569 a change of 10.4%
1/12/2020 FTSE Closed at 6384 points. Change of 1.88%. Total value traded through LSE was: £ 5,720,343,712 a change of -42.77%
30/11/2020 FTSE Closed at 6266 points. Change of -1.59%. Total value traded through LSE was: £ 9,995,620,767 a change of -0.31%
27/11/2020 FTSE Closed at 6367 points. Change of 0.08%. Total value traded through LSE was: £ 10,026,664,770 a change of 117.2%
26/11/2020 FTSE Closed at 6362 points. Change of -0.45%. Total value traded through LSE was: £ 4,616,288,955 a change of -37.01%
25/11/2020 FTSE Closed at 6391 points. Change of -0.64%. Total value traded through LSE was: £ 7,328,126,643 a change of -3.31%
24/11/2020 FTSE Closed at 6432 points. Change of 1.56%. Total value traded through LSE was: £ 7,578,918,377 a change of 19.1%