A G Barr for 19/06/2019

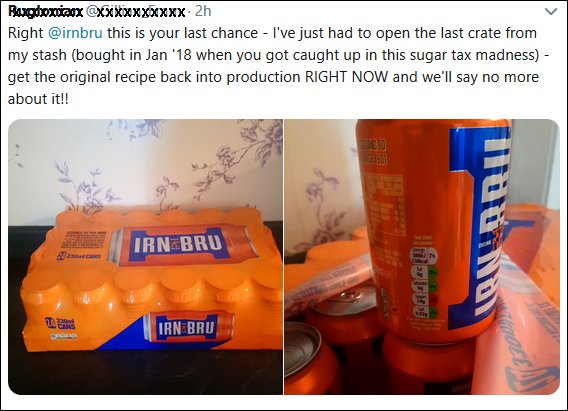
#Nasdaq #CAC40 Our report last Sept on the Scottish soft drink manufacturer (link here), proved rather successful, despite them gaining notoriety due to reduced sugar content of their staple product. In fact, the share price has proved capable of ridiculing the doomsayers. Even today, the tweet below appeared from some amiable fanatic who’d stockpiled a supply!
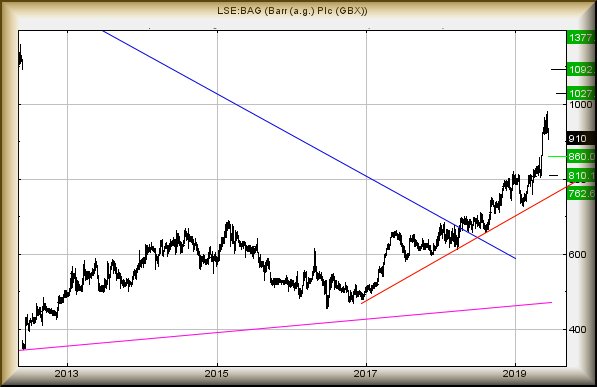
When we last reviewed A G Barr, we’d postulated 867p as a viable long term target and this ambition was achieved – and significantly bettered – during last month. The situation now is mildly interesting with movement now above 980 suggesting some continued growth toward 1027p next. If bettered, secondary is a longer term 1092p. Of course, we’ve got a “however”.

Our prior prediction of 867p has been exceeded but from a Big Picture viewpoint, it was a pretty major target level and one we’d expect some volatility around. Rather curiously, only now does it appear some collywobbles are appearing as below 906p is expected to enter slight reversal down to 860p next. We would expect a rebound at 860p, if only due to the market viewing the share price as “back-testing” (a nonsense term) the prior target level. Should 860p break, then we can calculate our secondary at 810p and visually, this is a point where it really must fizz a bit.

For now, we suspect some reversals are coming today the 860p, prior to another stab upward. Quite oddly, this is still showing a longer term aspiration up at 1377, an ambition which has remained valid since the price was in the 5 pound range!
FUTURES

Time Issued

Market

Price At Issue

Short Entry

Fast Exit

Slow Exit

Stop

Long Entry

Fast Exit

Slow Exit

Stop

Prior

10:34:39PM

BRENT

61.74


‘cess

10:36:57PM

GOLD

1347.25


Success

10:39:27PM

FTSE

7449.98


Success

10:42:59PM

FRANCE

5507.2

5437

5407

5363

5493

5510

5525.5

5579

5438

Success

10:44:14PM

GERMANY

12344.24


Success

10:46:27PM

US500

2921.07


Success

10:49:25PM

DOW

26493.7


Success

10:51:34PM

NASDAQ

7643.37

7508

7499.5

7436

7617

7691

7736

7782

7563

Success

10:54:57PM

JAPAN

21244


Success

18/06/2019 FTSE Closed at 7443 points. Change of 1.17%. Total value traded through LSE was: £ 6,830,875,186 a change of 34.03%

GBP/USD for 18/06/2019

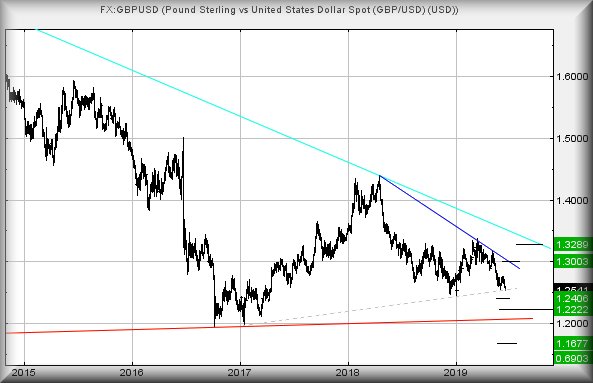
#Gold #SP500 At time of writing, 1.2540. It has been a few months since we reviewed this. The pairing attempted to strengthen and then failed. Now, it’s hovering with some intent toward weakness. We’re amazed to report, despite Brexit nonsense, Tory Leadership nonsense, or a US President visiting, nothing important has actually happened so far but… there are risks.

The big problem immediately is at 1.2525.   Travel below such a level now calculates with the potential of a visit to 1.240 next. Secondary, if broken, comes in at 1.2222 along with a fairly confident looking rebound potential. However, the big picture takes issues, should 1.222 break for any reason as the uptrend in RED since 1984 risks being ignored in favour of continual reversal down to 1.1677.

To be blunt, if it were a share, we’d already assume the intention will be 1.1677 as some sort of “bottom”, due to three quite distinct scenario pointing at this potential target. Thankfully, the pairing does not require a great deal of work to rubbish such a prospect, needing only better 1.310 (BLUE) to spoil all three trading calculations. In plain English, for those with horribly deep pockets, 1.310 is your stop loss level.

Surprisingly, there’s a tighter indicator which will suggest some relativistic strength is present. The pair need recover above 1.280 where we calculate movement toward 1.30 is possible. This creates the situation where even above 1.30 should give early warning it is “probably” not about to drop off a cliff.

For now, we suspect it’s heading to 1.1677, hopefully as bottom. Unfortunately, we do have numbers further down the line.

FUTURES

Time Issued

Market

Price At Issue

Short Entry

Fast Exit

Slow Exit

Stop

Long Entry

Fast Exit

Slow Exit

Stop

Prior

9:50:35PM

BRENT

60.42


9:52:24PM

GOLD

1339.84

1332

1327

1316

1344

1344

1347

1352

1336

‘cess

9:54:09PM

FTSE

7374


7332

9:55:38PM

FRANCE

5393.7


5367

Success

9:58:01PM

GERMANY

12094.66


12072

9:59:55PM

US500

2892.42

2882

2879

2872

2897

2900

2911.5

2927

2886

10:11:09PM

DOW

26142


10:12:37PM

NASDAQ

7538


10:14:53PM

JAPAN

21139


17/06/2019 FTSE Closed at 7357 points. Change of 0.16%. Total value traded through LSE was: £ 5,096,653,983 a change of -8.18%

Gold for 17/06/2019

#Brent #DAX The price of GOLD appears on the verge of becoming properly interesting again. Of course, this has only occurred since we started to speculate whether  Bitcoin was becoming the new ‘contrary’ indicator for the markets, overall. But now, something quite useful seems to be awakening Gold from its recent slumbers.

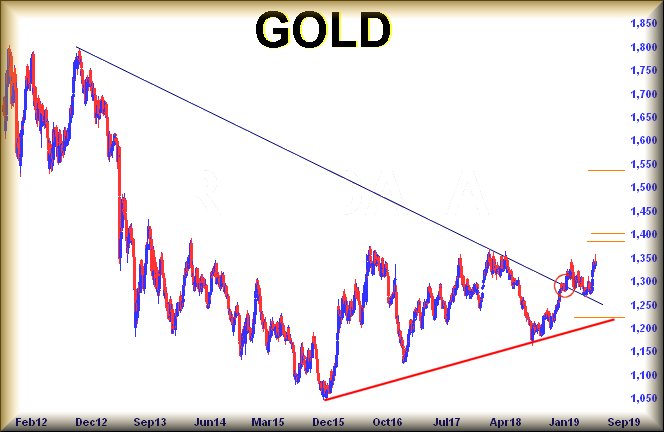
Perhaps we’re being churlish, describing the metal stuck in a 300 dollar range since 2014 as a “slumber” but a glance at the chart below illustrates, despite it going up and down a bit, we’d need be generous to attribute any link to Gold behaviour with, for instance, Dow Jones behaviour. However, all this appears to be on the point of changing but with an important caveat. If the metal actually CLOSES a day above 1350 dollars – or trades beyond 1357 dollars – there is a very reasonable excuse to speculate on some coming reasonable growth.

Visually there’s a historical issue at the 1350 level, thanks to a glass ceiling being in place since June 2014. If we forget arithmetic and simply use common sense, once the shiny stuff is seen solidly exceeding this Glass Ceiling (or Flat Trend), a majority of traders will assume, correctly we suspect, Gold is heading skyward. Thus far, we’ve only one reservation regarding its prospects and we’ve circled it on the chart.

The price broke the BLUE downtrend at 1288 dollars. Since the point of trend break, the metal has closed a couple of sessions below the point of trend break. This sort of thing tends dampen enthusiasm for the future, along with fouling our calculations.

For now, we can calculate trades above 1357 should bring an initial 1385 within range. If such a level is bettered, our secondary calculates at 1401 dollars though, to be honest, it could easily continue acceleration toward 1537, a level where some hesitation seems essential.

FUTURES

Time Issued

Market

Price At Issue

Short Entry

Fast Exit

Slow Exit

Stop

Long Entry

Fast Exit

Slow Exit

Stop

Prior

11:56:11AM

BRENT

61.56

60.3

59.475

58.56

61.67

61.95

62.19

62.82

60.95

11:58:15AM

GOLD

1342.32


Success

12:00:47PM

FTSE

7373


Shambles

12:02:55PM

FRANCE

5372.5


12:04:48PM

GERMANY

12126

12046

12014

11951

12111

12136

12148

12182

12076

12:07:48PM

US500

2890.92


12:13:04PM

DOW

26118.2


12:17:07PM

NASDAQ

7479.75


12:19:18PM

JAPAN

21040


14/06/2019 FTSE Closed at 7345 points. Change of -0.31%. Total value traded through LSE was: £ 5,550,869,325 a change of 12.74%

Ferrari and Friday FTSE for 14/06/2019

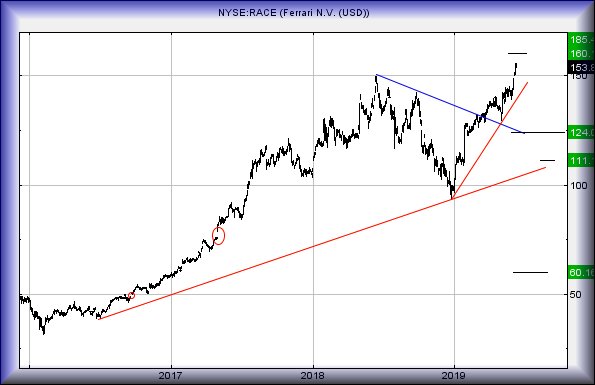
#Brent #France Despite enjoying a horrific F1 season, Ferrari share price appears to be resilient. We’d assumed, following last weekends attempt to “cheat” their way to victory, the price would take a hammering but instead, it remains on track with hope of giving further growth to new highs.

The furore over a Ferrari driver who, when pressured for the lead, drove off track, cutting a corner. Once the car was completely off track, the following Mercedes was thus in the lead until the Ferrari bloke rejoined the track and tried force him into the wall. For a few days, plenty of ex-F1 drivers were moaning Ferrari should not have suffered a penalty, that chorus of complaint abruptly stopping when technical data was published showing exactly what the Ferrari guy had done. There’s nothing quite like a bit of controversy to make a race interesting but we’d question why the Ferrari just didn’t cede the place they’d gained unfairly?

Perhaps the more interesting thing about this nonsense is final proof Ferrari performance on track has nothing to do with their share price!

The immediate situation allows for moves above 155.75 to provoke continued growth to 160 and a new all time high. Of greater interest is the secondary, should 155.75 be exceeded. We calculate Ferrari has sufficient impetus for a longer term boost to 185. For it all to go wrong, the share requires closing a session below 132 dollars. While perhaps below the immediate uptrend at 140 will serve to cancel the future, we’d really prefer the 132 level as the “safe” point for stop loss.

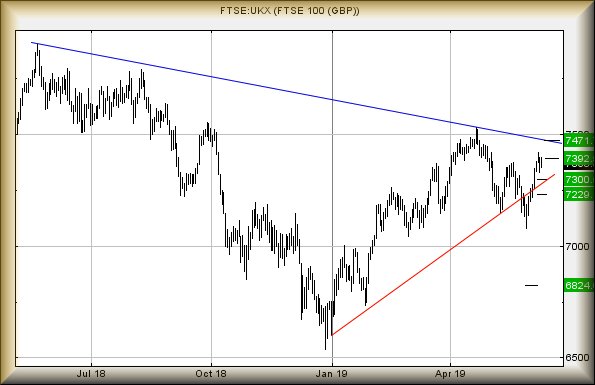
FTSE for FRIDAY Less controversial the Ferrari but no less exciting (okay, that’s rubbish), the UK index broke the immediate uptrend for 2019, only to recover above it a few weeks later. In fact, from a bigger picture perspective, it’s difficult not to admit we suspect the next major point of interest is around the 7,600 level. Our usual logic implies this means short positions are liable to underperform.

Near term, reversal below 7350 suggests coming travel down to 7300, a point we’d expect a rebound. In fact, we’d have considerable alarm if 7300 breaks as reversal to 7230 and below becomes very possible.

More likely, it appears moves below 7381 should power recovery to a truly useless 7392 points. What surprises, if 7392 is exceeded, is our secondary at 7471 points, along with a challenge of the downtrend since last year. Recent, often grudging, movements of the FTSE tend suggest hoping for a 100 point day should join other ambitions, such as wishing the media would focus less Brexit and political leadership campaigns. Surely there’s a cat up a tree somewhere, deserving an in-depth report.

FUTURES

Time Issued

Market

Price At Issue

Short Entry

Fast Exit

Slow Exit

Stop

Long Entry

Fast Exit

Slow Exit

Stop

Prior

9:47:40PM

BRENT

60.98

59.41

58.665

57.48

61.03

62.22

62.4375

62.9

60.37

‘cess

9:49:13PM

GOLD

1342.08


‘cess

9:54:08PM

FTSE

7376.82


9:56:01PM

FRANCE

5371.5

5352

5335

5303

5393

5395

5412

5432

5357

9:58:10PM

GERMANY

12180


‘cess

10:00:15PM

US500

2894.42


10:02:11PM

DOW

26121.6


Shambles

10:15:23PM

NASDAQ

7508.37


10:20:14PM

JAPAN

21062


Success

13/06/2019 FTSE Closed at 7368 points. Change of 0.01%. Total value traded through LSE was: £ 4,923,428,175 a change of -21.53%

Pendragon for 13/06/2019

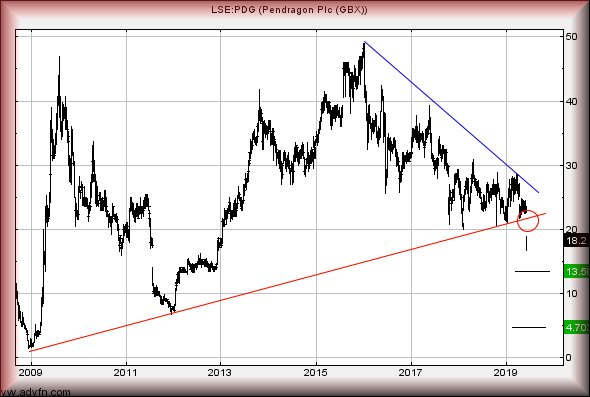
#NK225 #NasdaqIt’s worrying, how often we find ourselves examining shares with a view to decide “is it cheap yet?” The latest candidate, Pendragon, thankfully does not require the Wheeler Dealers treatment to make our mind up. In fact, a glance at the chart since 2009 should give sufficient warning.

It’s a bit surprising seeing one of the stars of the motor trade appear on the naughty step. Given low interest rates, along with massive improvements in fuel economy, we’d assumed cars were virtually driving themselves out of the showrooms. Similarly, the plethora of new vehicles cluttering up traffic jams appears to confirm someone, somewhere, is selling a lot of cars and, presumably, making a profit from it. However, there’s nothing quite like a Profit Warning to utterly foul a share price.

As the chart illustrates pretty clearly, the uptrend since 2009 has now been broken with the price forced below. It’s pretty unlikely it has seen bottom on the first surge, instead appearing  to suggest weakness now below 16.5p will prove capable of reversal to 13.5p and hopefully, a rebound. There are some quite extreme implications should the 13.5p level break as there’s the risk of freefall down to a longer term 4.70p. Visually, along with experience, tends suggest some sort of rebound by the 13.5p level but whether it lasts will greatly depend on if 13.5p breaks.

To give the impression this has all been a dreadful mistake, the share price needs reclaim RED which indicates 22.5p presently. If we accept the market has just indicated a new trend is commencing, we’re not holding our breath for such a signal anytime soon.

FUTURES

Time Issued

Market

Price At Issue

Short Entry

Fast Exit

Slow Exit

Stop

Long Entry

Fast Exit

Slow Exit

Stop

Prior

9:56:25PM

BRENT

59.5


Success

9:58:10PM

GOLD

1333.58


Success

10:01:25PM

FTSE

7363.98


Success

10:03:26PM

FRANCE

5367


10:05:35PM

GERMANY

12114.41


‘cess

10:07:32PM

US500

2880.52


10:09:35PM

DOW

26014.8


10:11:33PM

NASDAQ

7471.35

7456

7431.5

7377

7502

7521

7535.5

7562

7471

10:13:36PM

JAPAN

21050

21021

20934

20801

21197

21200

21276.75

21314

21030

Success


12/06/2019 FTSE Closed at 7367 points. Change of -0.42%. Total value traded through LSE was: £ 6,274,158,811 a change of 15.18%

Ted Baker for 12/06/2019

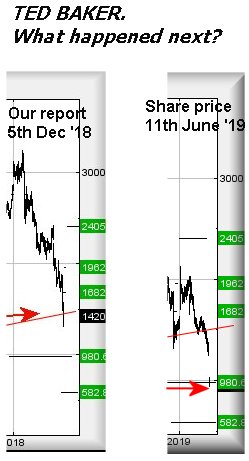
#DOW #NASDAQ Last time we reviewed Ted Baker was in December last year (link here) and the results since have proven quite spectacular. Successfully predicting a rise, while expecting a share price to fall is something fraught with danger. Somehow, Ted Baker managed fulfil all criteria, going up, meeting targets and then heading down anyway. Slightly mad!

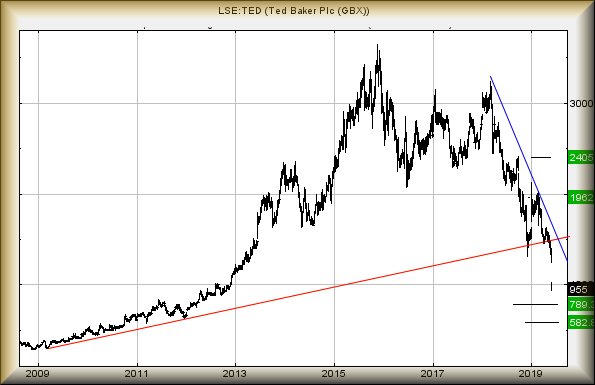
For now, the issues are fairly straightforward. We’d projected 980 as a fairly major point of interest – in a drop cycle which was yet to happen last December – and now, the share has broken below such a point, closing at 955p on 11th June 2019. As a result, we’re pretty far from convinced Ted Baker is “cheap” and worthy of any attention. Instead, it now appears ongoing weakness below 939 looks capable of continued reversal toward 789p next. It’s absolutely crucial 789p is not breached on an initial surge downward of “real” bottom, the point at which we’d hope for a bounce with some integrity, calculates at 582p.

We cannot reliably calculate any drop target below 582p which is not prefaced with a minus sign…

Now we are reassured as to which trend TED is adhering (clue: RED) the share apparently needs better 1545 simply to regain the trend. We’ve considerable doubts this shall prove possible anytime soon as it appears the market is intend on starting a brand new trend for the share. In fact, at present it requires exceed 1122p just to give a slight hint the drop has been overcooked (which does happen). But for now, there’s a strong argument suggesting Ted Baker is hanging on “a shoogly peg”, to employ an apt Scottish term.

Should it reach 582p, we shall become very interested in what comes next.

FUTURES

Time Issued

Market

Price At Issue

Short Entry

Fast Exit

Slow Exit

Stop

Long Entry

Fast Exit

Slow Exit

Stop

Prior

10:25:05PM

BRENT

61.76


10:26:35PM

GOLD

1327.76


‘cess

10:30:30PM

FTSE

7393.37


‘cess

10:33:23PM

FRANCE

5401


‘cess

10:35:53PM

GERMANY

12150.42


‘cess

10:41:35PM

US500

2887.07


10:43:58PM

DOW

26058.7

25990

25932

25836

26189

26258

26278

26444

26050

‘cess

10:45:38PM

NASDAQ

7514.92

7486

7448.5

7399

7544

7597

7618

7662

7526

‘cess

10:47:53PM

JAPAN

21184


‘cess

11/06/2019 FTSE Closed at 7398 points. Change of 0.31%. Total value traded through LSE was: £ 5,447,131,649 a change of 38.68%

10/06/2019 FTSE Closed at 7375 points. Change of 0.6%. Total value traded through LSE was: £ 3,927,877,834 a change of -29.61%

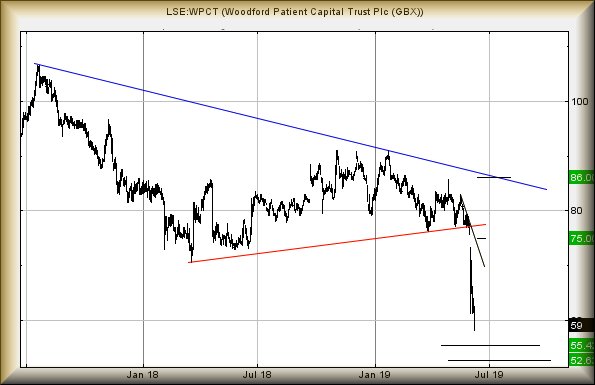
Woodford Patient Cp Trst for 11/06/2019

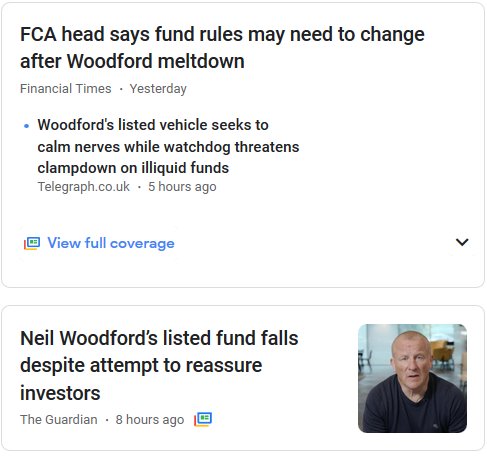
#Gold #SP500 In a welcome respite from Brexit nonsense, we’ve noticed Google News Business section has been dominated with a new subject. Hedge Fund guru, Neil Woodford, has a vehicle traded on the FTSE250 with the price recently getting a little bit of a hammering. It has provoked emails!

To be honest, we’d never heard of the bloke until he became famous for all the wrong reasons but, despite receiving emails regarding WPCT, we’d probably be covering it anyway. The share price is doing something almost interesting. From our perspective, the issue is fairly simple; where’s bottom going to be?

The answer, thankfully, is equally simple but what really interests us are two distinctly different calculations. Whether we employ Big Picture arguments or near term, we’re calculating a bottom price anytime soon. (Bottom, obviously not ever guaranteed, is the level at which we’d hope for a substantial rebound)

In the case of Woodford, it appears continued weakness below 58p faces reversal to an initial 55p with secondary, if broken, at 52.6p. The proximity of each number tends give hope the price to stop falling. We cannot calculate below these levels with any degree of accuracy – or hope. Working on the hope the market intends designate bottom in the 50’s, how high could it be expected to bounce? At this point, we’ve got to abandon our software to a certain extent and simply review the visuals. Any initial bounce would make sense to attempt an initial 75p, essentially making a challenge of the manipulation gap in the company share price. Our secondary, if such a level is bettered, comes along at a doubtful 86p, challenging the downtrend since 2017.

Finally, to inject common sense into the discussion, please remember we cannot calculate a target below 52.6p.

FUTURES

Time Issued

Market

Price At Issue

Short Entry

Fast Exit

Slow Exit

Stop

Long Entry

Fast Exit

Slow Exit

Stop

Prior

10:12:54PM

BRENT

62.03


‘cess

10:15:29PM

GOLD

1328.62

1324.6

1321.5

1313

1333

1331

1333

1336

1324

10:38:07PM

FTSE

7371.28


‘cess

10:39:19PM

FRANCE

5373.4


10:41:50PM

GERMANY

12102


10:44:10PM

US500

2889.27

2869

2864

2850

2893

2906

2924

2952

2868

‘cess

10:46:55PM

DOW

26085


‘cess

10:50:21PM

NASDAQ

7515.55


Success

10:52:22PM

JAPAN

21118


‘cess

10/06/2019 FTSE Closed at 7375 points. Change of 0.6%. Total value traded through LSE was: £ 3,927,877,834 a change of -29.61%