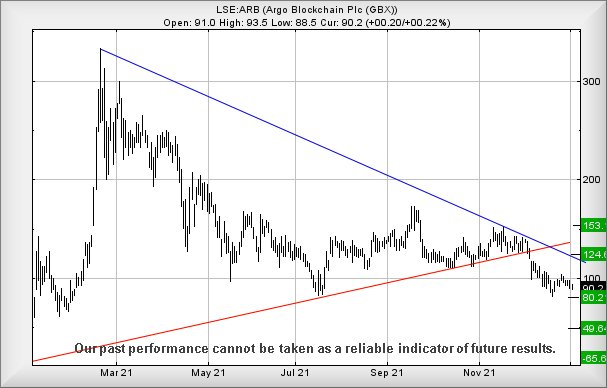
#US500 #DAX Our previous review of Argo Blockchain was perfect in every respect. Except one. There was no triggering event to promote a price rise, itself not an issue, but worse, the potential drop level was only shown on our chart. The share price managed to immolate itself to our illustrated 86p drop target level, completely without any analysis! We had, rather arrogantly, assumed the price intended head upward, thus feeling there was not need to give a “panic” trigger!
We’re curious if the current state of Bitcoin shall now negatively impact Argo Blockchain share price. When we previously looked at Bitcoin last November, we’d given an initial drop target around $47,000 with secondary, if broken, around $38,000. Given Bitcoin is presently trading at $43,000, we’re inclined to anticipate ongoing reversals to somewhere around our $38,000 level. We should mention an unpleasant risk if the $38k level breaks as it risks promoting ongoing reversal down to a hopeful bottom of $29,000. Bitcoin currently needs above $52,500 to dig itself out of this mess.
When we superimpose Bitcoin movements over the last 6 months with Argo Blockchain, there seems to be some sort of link with Bitcoin trend influences. As a result, weakness now below 88p risks triggering reversal to 80p next with secondary, if broken, down at 49p and hopefully a bounce. Importantly, we should mention we cannot calculate below 49p, thanks to target levels suddenly being prefaced by minus signs.
Presently trading around 91p, the share price needs exceed 109p to give a reasonable early warning for coming recovery as this calculates with the potential of an initial 124p with secondary, if exceeded, working out at 153p and almost certain hesitation.
Many thanks, again, to the nice folk who discovered fascinating adverts on this page. Each visit is like getting a coffee bought for us.
FUTURES
| Time Issued | Market | Price At Issue | Short Entry | Fast Exit | Slow Exit | Stop | Long Entry | Fast Exit | Slow Exit | Stop | Prior |
| 9:50:18PM | BRENT | 79.92 | 79.7 | 79.495 | Subscribe | 80.5 | 81.31 | 81.55 | for more | 80.1 | ‘cess |
| 9:51:53PM | GOLD | 1810.4 | 1808 | 1803 | Subscribe | 1817 | 1830 | 1834 | for more | 1814 | Success |
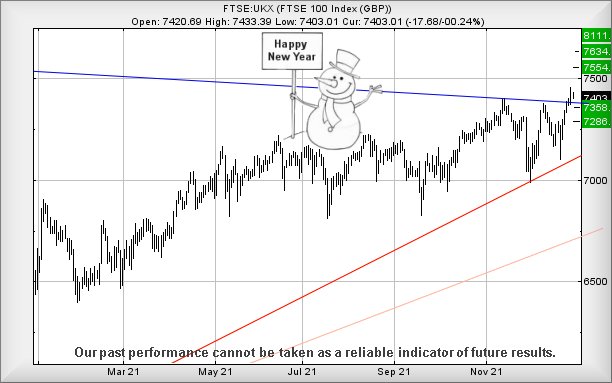
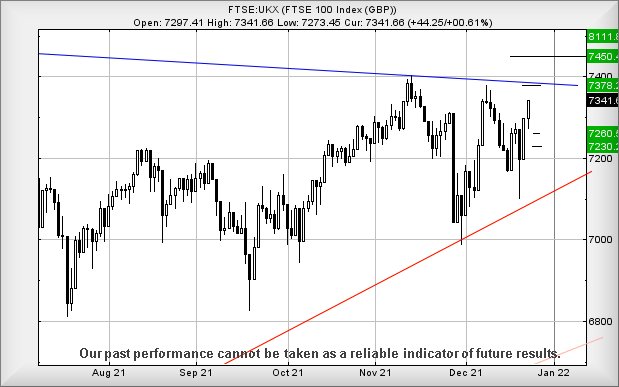
| 9:54:00PM | FTSE | 7460.9 | 7445 | 7425 | Subscribe | 7499 | 7530 | 7550 | for more | 7480 | |
| 9:56:14PM | FRANCE | 7321 | 7295 | 7272 | 7345 | 7369 | 7388 | 7330 | |||
| 9:58:20PM | GERMANY | 16097 | 16077 | 15972 | 16203 | 16196 | 16236 | 16110 | |||
| 10:01:01PM | US500 | 4700.57 | 4697 | 4691 | 4738 | 4739 | 4744 | 4712 | Success | ||
| 10:03:55PM | DOW | 36433 | 36395 | 36321 | 36605 | 36630 | 36661 | 36450 | Shambles | ||
| 10:07:12PM | NASDAQ | 15764 | 15752 | 15631 | 15885 | 15933 | 15956 | 15822 | Success | ||
| 10:14:32PM | JAPAN | 29017 | 28987 | 28906 | 29130 | 29155 | 29198 | 28993 |
5/01/2022 FTSE Closed at 7516 points. Change of 0.15%. Total value traded through LSE was: £ 4,850,064,854 a change of -31.07%
4/01/2022 FTSE Closed at 7505 points. Change of 1.64%. Total value traded through LSE was: £ 7,036,052,579 a change of 378.45%
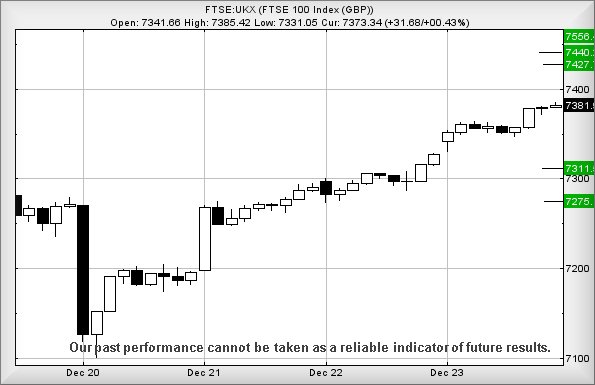
31/12/2021 FTSE Closed at 7384 points. Change of -0.26%. Total value traded through LSE was: £ 1,470,600,972 a change of -36.25%
30/12/2021 FTSE Closed at 7403 points. Change of -100%. Total value traded through LSE was: £ 2,306,886,388 a change of 0%
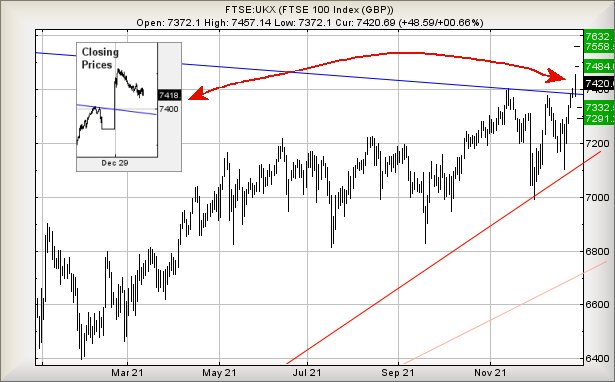
29/12/2021 FTSE Closed at 7420 points. Change of 0%. Total value traded through LSE was: £ 3,844,071,499 a change of 0%
SUCCESS above means both FAST & SLOW targets were met. ‘CESS means just the FAST target met and probably the next time it is exceeded, movement to the SLOW target shall commence.
Our commentary is in two sections. Immediately below are today’s updated comments. If our commentary remains valid, the share can be found in the bottom section which has a RED heading. Hopefully, this will mean you no longer need to flip back through previous reports. HYPERLINKS DISABLED IN THIS VERSION
Please remember, all prices are mid-price (halfway between the Buy and Sell). When we refer to a price CLOSING above a specific level, we are viewing the point where we can regard a trend as changing. Otherwise, we are simply speculating on near term trading targets. Our website is www.trendsandtargets.com.
UPDATE. We often give an initial and a secondary price. If the initial is exceeded, we still expect it to fall back but the next time the initial is bettered, the price should continue to the secondary. The converse it true with price drops.
We can be contacted at info@trendsandtargets.com. Spam filters set to maximum so only legit emails get through…
Section One – Outlook Updated Today. Click here for Section Two – Outlook Remains Valid shares
Click Epic to jump to share: LSE:AVCT Avacta** **LSE:BARC Barclays** **LSE:BP. BP PLC** **LSE:EME Empyrean** **LSE:EZJ EasyJet** **LSE:FRES Fresnillo** **LSE:GKP Gulf Keystone** **LSE:LLOY Lloyds Grp.** **LSE:MKS Marks and Spencer** **LSE:NWG Natwest** **LSE:POG Petrop etc** **LSE:RBD Reabold Resources PLC** **LSE:RMG Royal Mail** **LSE:TSCO Tesco** **LSE:ZOO Zoo Digital** **
********
Updated charts published on : Avacta, Barclays, BP PLC, Empyrean, EasyJet, Fresnillo, Gulf Keystone, Lloyds Grp., Marks and Spencer, Natwest, Petrop etc, Reabold Resources PLC, Royal Mail, Tesco, Zoo Digital,
LSE:AVCT Avacta Close Mid-Price: 115.6 Percentage Change: -2.86% Day High: 117 Day Low: 113
If Avacta experiences continued weakness below 113, it will invariably le ……..
</p
View Previous Avacta & Big Picture ***
LSE:BARC Barclays. Close Mid-Price: 197.92 Percentage Change: + 0.64% Day High: 199.2 Day Low: 196.34
Movement next above 200 suggests an initial 205. Crucially, if bettered ou ……..
</p
View Previous Barclays & Big Picture ***
LSE:BP. BP PLC. Close Mid-Price: 354.8 Percentage Change: + 1.08% Day High: 358.25 Day Low: 351.35
In the event of BP PLC enjoying further trades beyond 359, the share shou ……..
</p
View Previous BP PLC & Big Picture ***
LSE:EME Empyrean Close Mid-Price: 6 Percentage Change: -1.64% Day High: 6.1 Day Low: 5.8
Continued weakness against EME taking the price below 5.8 calculates as l ……..
</p
View Previous Empyrean & Big Picture ***
LSE:EZJ EasyJet. Close Mid-Price: 616.6 Percentage Change: + 1.51% Day High: 627.4 Day Low: 602.4
Continued trades against EZJ with a mid-price ABOVE 627.4 should improve ……..
</p
View Previous EasyJet & Big Picture ***
LSE:FRES Fresnillo. Close Mid-Price: 855.6 Percentage Change: + 0.35% Day High: 861.8 Day Low: 843.2
This is looking a bit dodgy as weakness below 843 now risks promoting reve ……..
</p
View Previous Fresnillo & Big Picture ***
LSE:GKP Gulf Keystone. Close Mid-Price: 203.5 Percentage Change: + 3.19% Day High: 207 Day Low: 196
Further movement against Gulf Keystone ABOVE 207 should improve accelerat ……..
</p
View Previous Gulf Keystone & Big Picture ***
LSE:LLOY Lloyds Grp.. Close Mid-Price: 50.68 Percentage Change: + 1.54% Day High: 51.24 Day Low: 50.09
Further movement against Lloyds Grp. ABOVE 51.25 should still improve acce ……..
</p
View Previous Lloyds Grp. & Big Picture ***
LSE:MKS Marks and Spencer. Close Mid-Price: 249.7 Percentage Change: + 4.70% Day High: 250.4 Day Low: 240.8
In the event of Marks and Spencer enjoying further trades beyond 250.4, t ……..
</p
View Previous Marks and Spencer & Big Picture ***
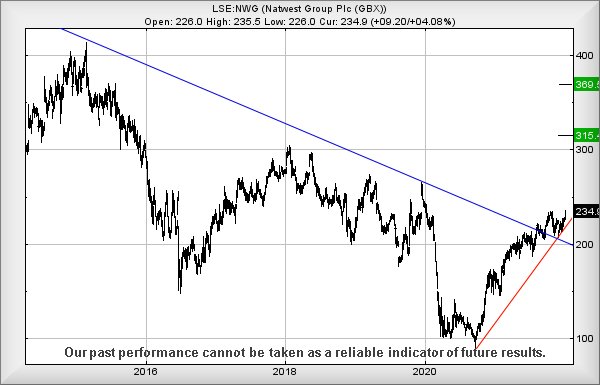
LSE:NWG Natwest. Close Mid-Price: 237.4 Percentage Change: + 1.06% Day High: 239.2 Day Low: 233.5
All Natwest needs are mid-price trades ABOVE 240 to improve acceleration ……..
</p
View Previous Natwest & Big Picture ***
LSE:POG Petrop etc Close Mid-Price: 17.99 Percentage Change: -5.22% Day High: 18.96 Day Low: 17.92
Target met. In the event Petrop etc experiences weakness below 17.92 it c ……..
</p
View Previous Petrop etc & Big Picture ***
LSE:RBD Reabold Resources PLC. Close Mid-Price: 0.19 Percentage Change: + 5.56% Day High: 0.2 Day Low: 0.18
Further movement against Reabold Resources PLC ABOVE 0.2 should improve a ……..
</p
View Previous Reabold Resources PLC & Big Picture ***
LSE:RMG Royal Mail. Close Mid-Price: 526.8 Percentage Change: + 0.73% Day High: 531.4 Day Low: 523
Continued trades against RMG with a mid-price ABOVE 531.4 should improve ……..
</p
View Previous Royal Mail & Big Picture ***
LSE:TSCO Tesco. Close Mid-Price: 296.7 Percentage Change: + 0.94% Day High: 297.4 Day Low: 292.4
Target met. All Tesco needs are mid-price trades ABOVE 298 to improve acc ……..
</p
View Previous Tesco & Big Picture ***
LSE:ZOO Zoo Digital. Close Mid-Price: 132.5 Percentage Change: + 2.32% Day High: 132.5 Day Low: 129.5
Continued trades against ZOO with a mid-price ABOVE 132.5 should improve ……..
</p
View Previous Zoo Digital & Big Picture ***