#Gold #SP500
It was a bit of a surprise to discover M&G Plc are now starting to look interesting. A few weeks ago, we covered Prudential Plc, completely unrelated to Prudential Assurance of which M&G are the direct parent company. Perhaps there’s something about the word “Prudential” which the markets currently like, especially as M&G Plc currently look capable of enjoying some share price growth.
However, we can’t continue without first pausing to highlight some exquisite groupthink gibberish on their corporate website; “Following the launch of PruFund Planet, the UK’s first smoothed UK savings proposition that offers positive societal and environmental outcomes, we continue to expand our range of thematic and sustainable propositions.”
Why, oh why, couldn’t they have just said, “we’re in business to make money through investment!”
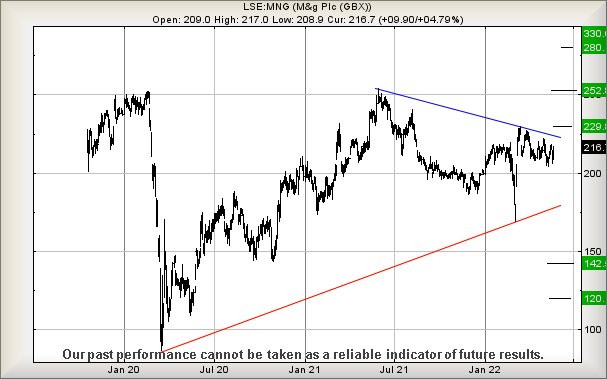
Their company share price appears on the crux of becoming interesting, the only meaningful movement this year being due to the Russian drop in March. Now above just 222p looks mildly useful, apparently capable of triggering recovery to a near term 229p. Above this level and the price risks becoming more exciting, our calculations producing a secondary target at 252p and almost certain hesitation, thanks to this coinciding with previous highs back in 2020 and 2021.
One feature about such hesitation is it’s easy to assume it shall be inspired by the Babe brigade, those folk who bought at previous highs and opting to ‘bail at break even’. Generally, when such selling pressure appears, it’s effects tend diminish with time and as this shall be the share price’s potential 3rd attempt at this level, we’re not entirely nervous by suggesting above 252p should fuel longer term price growth to 280p and beyond, new all time high levels.
If everything intends go horribly wrong, the share price currently needs slump below 178p. Weakness such as this risks provoking a downward spiral to an initial 142 with secondary, if broken, at 120p and hopefully a trampoline bottom.
Massive thanks to the kind folk who discovered a fascinating advert to visit on this page on Monday. The clicks paid for the increase in Taylors coffee bean prices (not kidding!)
FUTURES
| Time Issued | Market | Price At Issue | Short Entry | Fast Exit | Slow Exit | Stop | Long Entry | Fast Exit | Slow Exit | Stop | Prior |
| 10:56:55PM | BRENT | 111.33 | ‘cess | ||||||||
| 10:58:37PM | GOLD | 1853.84 | 1846 | 1838 | 1829 | 1858 | 1865 | 1873 | 1886 | 1851 | ‘cess |
| 11:01:40PM | FTSE | 7476.33 | ‘cess | ||||||||
| 11:03:37PM | FRANCE | 6346 | Success | ||||||||
| 11:05:39PM | GERMANY | 14055.9 | ‘cess | ||||||||
| 11:08:02PM | US500 | 3938 | 3914 | 3906 | 3880 | 3951 | 3984 | 4011 | 4078 | 3945 | ‘cess |
| 11:10:10PM | DOW | 31748 | Success | ||||||||
| 11:14:03PM | NASDAQ | 11837 | ‘cess | ||||||||
| 11:15:59PM | JAPAN | 26921 | Success |
23/05/2022 FTSE Closed at 7513 points. Change of 1.68%. Total value traded through LSE was: £ 6,535,271,427 a change of -11.05%
20/05/2022 FTSE Closed at 7389 points. Change of 1.19%. Total value traded through LSE was: £ 7,347,493,432 a change of 4.36%
19/05/2022 FTSE Closed at 7302 points. Change of -1.83%. Total value traded through LSE was: £ 7,040,483,001 a change of 0.49%
18/05/2022 FTSE Closed at 7438 points. Change of -1.06%. Total value traded through LSE was: £ 7,006,146,182 a change of 17.44%
17/05/2022 FTSE Closed at 7518 points. Change of 0.72%. Total value traded through LSE was: £ 5,965,741,785 a change of -1.9%
16/05/2022 FTSE Closed at 7464 points. Change of 0.62%. Total value traded through LSE was: £ 6,081,329,244 a change of -11.87%
13/05/2022 FTSE Closed at 7418 points. Change of 2.56%. Total value traded through LSE was: £ 6,900,608,037 a change of -14.47%
SUCCESS above means both FAST & SLOW targets were met. ‘CESS means just the FAST target met and probably the next time it is exceeded, movement to the SLOW target shall commence.
Our commentary is in two sections. Immediately below are today’s updated comments. If our commentary remains valid, the share can be found in the bottom section which has a RED heading. Hopefully, this will mean you no longer need to flip back through previous reports. HYPERLINKS DISABLED IN THIS VERSION
Please remember, all prices are mid-price (halfway between the Buy and Sell). When we refer to a price CLOSING above a specific level, we are viewing the point where we can regard a trend as changing. Otherwise, we are simply speculating on near term trading targets. Our website is www.trendsandtargets.com.
UPDATE. We often give an initial and a secondary price. If the initial is exceeded, we still expect it to fall back but the next time the initial is bettered, the price should continue to the secondary. The converse it true with price drops.
We can be contacted at info@trendsandtargets.com. Spam filters set to maximum so only legit emails get through…
Section One – Outlook Updated Today. Click here for Section Two – Outlook Remains Valid shares
Click Epic to jump to share: LSE:AV. Aviva** **LSE:AZN Astrazeneca** **LSE:CCL Carnival** **LSE:EMG MAN** **LSE:GLEN Glencore Xstra** **LSE:IQE IQE** **LSE:ITRK Intertek** **LSE:SNN Sanne Plc** **LSE:STAN Standard Chartered** **LSE:ZOO Zoo Digital** **
********
Updated charts published on : Aviva, Astrazeneca, Carnival, MAN, Glencore Xstra, IQE, Intertek, Sanne Plc, Standard Chartered, Zoo Digital,
LSE:AV. Aviva. Close Mid-Price: 429.2 Percentage Change: + 4.15% Day High: 431.3 Day Low: 407.1
In the event of Aviva enjoying further trades beyond 431.3, the share sho ……..
</p
View Previous Aviva & Big Picture ***
LSE:AZN Astrazeneca. Close Mid-Price: 10600 Percentage Change: + 1.01% Day High: 10634 Day Low: 10454
Continued trades against AZN with a mid-price ABOVE 10634 should improve ……..
</p
View Previous Astrazeneca & Big Picture ***
LSE:CCL Carnival Close Mid-Price: 952.8 Percentage Change: -2.40% Day High: 995.8 Day Low: 923
If Carnival experiences continued weakness below 923, it will invariably ……..
</p
View Previous Carnival & Big Picture ***
LSE:EMG MAN. Close Mid-Price: 248.3 Percentage Change: + 5.17% Day High: 246.7 Day Low: 237.9
Continued trades against EMG with a mid-price ABOVE 246.7 should improve ……..
</p
View Previous MAN & Big Picture ***
LSE:GLEN Glencore Xstra. Close Mid-Price: 513 Percentage Change: + 3.15% Day High: 516.7 Day Low: 497.45
Glencore appear worthy of attention as above 517 now looks capable of move ……..
</p
View Previous Glencore Xstra & Big Picture ***
LSE:IQE IQE. Close Mid-Price: 29.25 Percentage Change: + 2.45% Day High: 29.3 Day Low: 27.8
Weakness on IQE below 27.8 will invariably lead to 27p with secondary (if ……..
</p
View Previous IQE & Big Picture ***
LSE:ITRK Intertek Close Mid-Price: 4706 Percentage Change: -3.94% Day High: 4880 Day Low: 4640
Target met. If Intertek experiences continued weakness below 4640, it wil ……..
</p
View Previous Intertek & Big Picture ***
LSE:SNN Sanne Plc. Close Mid-Price: 902 Percentage Change: + 1.01% Day High: 904 Day Low: 883
If Sanne Plc experiences continued weakness below 883, it will invariably ……..
</p
View Previous Sanne Plc & Big Picture ***
LSE:STAN Standard Chartered. Close Mid-Price: 602 Percentage Change: + 2.63% Day High: 602 Day Low: 588.6
Continued trades against STAN with a mid-price ABOVE 602 should improve t ……..
</p
View Previous Standard Chartered & Big Picture ***
LSE:ZOO Zoo Digital Close Mid-Price: 104.5 Percentage Change: -7.11% Day High: 112.5 Day Low: 106.5
If Zoo Digital experiences continued weakness below 106.5, it will invari ……..
</p
View Previous Zoo Digital & Big Picture ***