#Brent #DAX On Friday, we provided a perfect illustration as to how crazy the markets are presently. We’d given 5,799 as a reasonable UP target, a number the UK market dusted off after just 20 minutes, reaching 5,813 by 8.30am. As a result, all bets were off as there was a fair chance things had taken a “stupid pill”. Strangely, despite this flamboyance, only the lowly UK AIM market ended Friday with an expression of confidence. The European markets opted to end the session questioning the future whereas US markets appear to be optimistic!
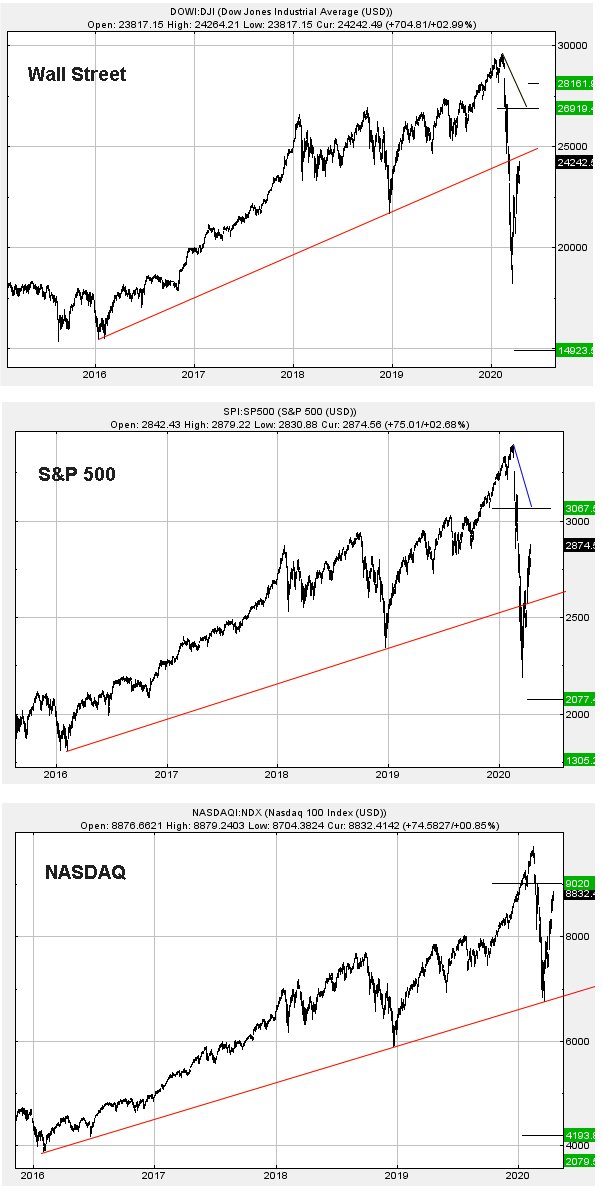
We’re utterly beyond trying to figure out the “why” and instead, opted to embrace “why not”. To aid with this picture of the future, it’s worth looking at a collection of chart positions. For a fairly arbitrary reason, we’ve chosen the start of 2016 as the point to commence a baseline for growth. Our reason for selecting this as a start point for the USA markets came from the Nasdaq behaviour. For some reason, the initial Covid-19 reversal bounced at this trend on the Nasdaq. Both the DOW and SP500 opted to break their uptrend, the S&P already recovering above, the DOW on the edge of doing so.
The immediate situation is fairly straightforward. Should the DOW now trade above 24,600 points, it shall be viewed as entering a cycle to 26,900 points initially.
Should the S&P 500 now trade above 28,80 points, it shall be seen as heading to 3,067 points initially.
And if the Nasdaq now betters 8,880 points, it seems 9,020 shall provide a fairly straightforward ambition.
We’ve some trouble accepting this series of forecasts, despite our software suggesting it’s genuine. To be blunt, there’s too much going on to allow such insane levels of confidence. The proposals shown tend to suggest the levels of market reversal, unemployment, and deaths were all a dreadful mistake. But as we wrote earlier, there’s also a strong argument favouring people are hoping things will get better.
In keeping with our preference to show both sides of the coin, all the charts show reversal targets, each of which has already triggered if we use our conventional methodology. Early warning of things going wrong (again) should be weakness on the DOW below 21,700 points. On the S&P, movement below 2,570 should justify concern, and on the Nasdaq, below 7,700 justifies running shoes.
We’ll publish a similar comparative argument for the major European indices.

|
Time Issued |
Market |
Price At Issue |
Short Entry |
Fast Exit |
Slow Exit |
Stop |
Long Entry |
Fast Exit |
Slow Exit |
Stop |
Prior |
|
5:33:03PM |
BRENT |
30.32 |
29.67 |
28.27 |
25.39 |
31 |
31 |
31.56 |
32.36 |
29.8 |
|
|
5:35:00PM |
GOLD |
1684 |
Success |
||||||||
|
7:08:09PM |
FTSE |
5834 |
Success |
||||||||
|
7:12:56PM |
FRANCE |
4527 |
Scam |
||||||||
|
7:14:53PM |
GERMANY |
10714.24 |
10530 |
10421.5 |
10306 |
10680 |
10768 |
10829.75 |
10925 |
10598 |
Success |
|
7:24:09PM |
US500 |
2878.77 |
‘cess |
||||||||
|
7:26:46PM |
DOW |
24269 |
Success |
||||||||
|
9:06:18PM |
NASDAQ |
8824.12 |
|||||||||
|
9:27:43PM |
JAPAN |
19570 |
Success |
17/04/2020 FTSE Closed at 5786 points. Change of 2.81%. Total value traded through LSE was: £ 7,284,056,629 a change of 24.33%
16/04/2020 FTSE Closed at 5628 points. Change of 0.55%. Total value traded through LSE was: £ 5,858,772,454 a change of -15.73%
15/04/2020 FTSE Closed at 5597 points. Change of -3.35%. Total value traded through LSE was: £ 6,952,759,094 a change of 5.89%
14/04/2020 FTSE Closed at 5791 points. Change of -0.87%. Total value traded through LSE was: £ 6,566,152,057 a change of -6.93%
9/04/2020 FTSE Closed at 5842 points. Change of 2.91%. Total value traded through LSE was: £ 7,054,916,655 a change of 16.86%
8/04/2020 FTSE Closed at 5677 points. Change of -0.47%. Total value traded through LSE was: £ 6,036,851,647 a change of -23.98%