#Gold #Stoxx50 One of the baseline positions we take in deciding how well a specific share is doing is pretty simple. Is it trading above its price level, pre-pandemic? If so, some slight optimism becomes possible but the other stance also has merit. How has it performed since the pandemic drop and are their any signs of recovery? am efully a bottom. The chart below for IAG would be funny, aside for the fact it represents what’s happened to the funds of real people!
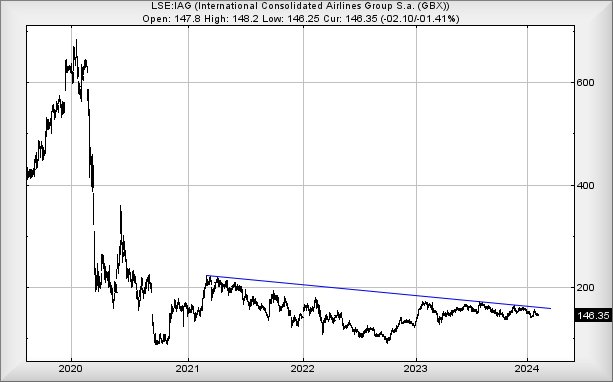
British Airways owner IAG (we cannot be bothered writing their full name again) enjoyed a dreadful pandemic as shown above, their share price steadfastly refusing to do anything useful. At a glance, there are a couple of hints it may have bottomed but such an attitude is only a negative news report away from being proven utterly wrong. Our preference, always, is to await a price actually making positive movements before daring to express optimism. After all, there is absolutely no rule a share price should bounce. Rather often, absence of a bounce can be indicative the market knows/suspects something investors are unaware of, so perhaps it can prove worthwhile to either look elsewhere or, as we’ve done in this instance, take a look at the wider marketplace.
Currently, IAG share price is at just 22% of its level before the pandemic hit. Easyjet, also suffering, are not in such a pained position with their share price at 37% of the pre-pandemic price. Across the Atlantic, Delta are at 67% and AAL at 48% of their pre-Covid price. And bad boy on the block, Jet Blue, appear to be languishing at just 27% of their value before everything went wrong in February 2020. But visiting Germany discovers Lufthansa soaring, their share price now at 80% of their pre-pandemic price.
This level exercise tends hint quite strongly airline stocks can certainly recover and, from a European context if Lufthansa are to be believed, quite strongly. We’d warn our 6 company sample is far from representative of the entire industry, it was just a collection of the more famous airline company names. Somehow or other, in the test of values, floating germ containers, the cruise line Carnival were included and even they are at 36% of share value before the virus hit. In other words, doing a lot better than British Airways’ owner.
Quite why IAG are at the bottom of the heap in this tuppenybit survey, especially as airlines appear to be flying again and fuel costs are reversing, escapes us. It may just be the case the market is awaiting IAG announcing a return to paying dividends or giving away enhanced air miles to folk who work on the stock market. Who knows, a quick glance at Google News didn’t reveal any immediate quick answer for us to regurgitate as something of interest.
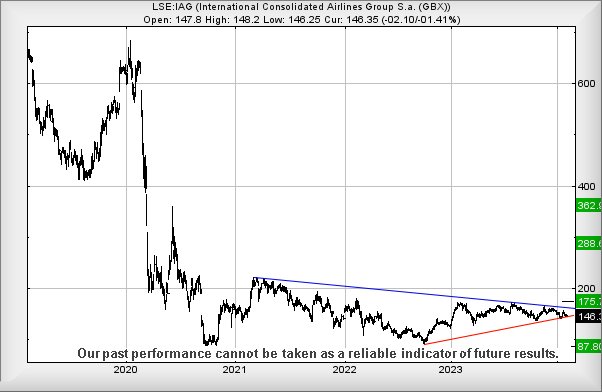
About the only nice thing we can say about IAG is their share price failed to drop to our miserable “bottom” level around 81p as speculated in 2022. Instead, it hit 90p, since recovering in an extremely half hearted manner. However, it certainly appears what should be a valid downtrend (Blue) has formed, hopefully capable of giving us trigger levels for proper movement upward.
Currently, above 162p (Blue) should hopefully prove capable of triggering price recovery to an initial 175p. We would regard closure above such a level as significant for the longer term, ticking a pretty big box suggesting IAG has commenced some real recovery. In such a case, closure above 175p should mark the dawn of an age, where a future 288p becomes a believable target with a third level of 362p calculating as viable, along with almost certain hesitation.
But for now, watching British Airways is a bit like watching one of these runway de-icer machines, trundling along slowly under the snow glare of a scary Denver Airport whiteout, with little hope of ever becoming airborne. But this, of course, doesn’t mean anyone should stop watching them, or even IAG share prices.
Should everything intend go wrong, below 138p looks troubling, capable of commencing a descent to an eventual bottom at 87p.
FUTURES
| Time Issued | Market | Price At Issue | Short Entry | Fast Exit | Slow Exit | Stop | Long Entry | Fast Exit | Slow Exit | Stop | Prior |
| 8:56:22PM | BRENT | 7925.7 | ‘cess | ||||||||
| 8:59:02PM | GOLD | 2034.49 | 2031 | 2027 | 2021 | 2039 | 2045.17 | 2049 | 2060 | 2031 | ‘cess |
| 9:04:12PM | FTSE | 7634 | |||||||||
| 9:07:29PM | STOX50 | 4685.8 | 4685 | 4676 | 4665 | 4695 | 4700 | 4710 | 4721 | 4682 | |
| 9:15:40PM | GERMANY | 16930 | ‘cess | ||||||||
| 9:26:20PM | US500 | 4994 | Success | ||||||||
| 9:45:11PM | DOW | 38686 | Success | ||||||||
| 9:50:04PM | NASDAQ | 17763.4 | Success | ||||||||
| 9:52:34PM | JAPAN | 36358 |
7/02/2024 FTSE Closed at 7628 points. Change of -0.69%. Total value traded through LSE was: £ 5,688,534,403 a change of 1.67%
6/02/2024 FTSE Closed at 7681 points. Change of 0.91%. Total value traded through LSE was: £ 5,595,046,133 a change of -6.77%
5/02/2024 FTSE Closed at 7612 points. Change of -0.04%. Total value traded through LSE was: £ 6,001,091,520 a change of -6.39%
4/02/2024 FTSE Closed at 7615 points. Change of 0%. Total value traded through LSE was: £ 6,410,714,874 a change of 39.22%
2/02/2024 FTSE Closed at 7615 points. Change of -0.09%. Total value traded through LSE was: £ 4,604,656,485 a change of -16.86%
1/02/2024 FTSE Closed at 7622 points. Change of -0.1%. Total value traded through LSE was: £ 5,538,356,181 a change of -5.22%
31/01/2024 FTSE Closed at 7630 points. Change of -0.47%. Total value traded through LSE was: £ 5,843,417,633 a change of 22.29% 
SUCCESS above means both FAST & SLOW targets were met. ‘CESS means just the FAST target met and probably the next time it is exceeded, movement to the SLOW target shall commence.
Our commentary is in two sections. Immediately below are today’s updated comments. If our commentary remains valid, the share can be found in the bottom section which has a RED heading. Hopefully, this will mean you no longer need to flip back through previous reports. HYPERLINKS DISABLED IN THIS VERSION
Please remember, all prices are mid-price (halfway between the Buy and Sell). When we refer to a price CLOSING above a specific level, we are viewing the point where we can regard a trend as changing. Otherwise, we are simply speculating on near term trading targets. Our website is www.trendsandtargets.com.
UPDATE. We often give an initial and a secondary price. If the initial is exceeded, we still expect it to fall back but the next time the initial is bettered, the price should continue to the secondary. The converse it true with price drops.
We can be contacted at info@trendsandtargets.com. Spam filters set to maximum so only legit emails get through…
Section One – Outlook Updated Today. Click here for Section Two – Outlook Remains Valid shares
Click Epic to jump to share: LSE:BT.A British Telecom** **LSE:ITV ITV** **LSE:RR. Rolls Royce** **LSE:STAR Star Energy** **LSE:TW. Taylor Wimpey** **LSE:VOD Vodafone** **LSE:ZOO Zoo Digital** **
********
Updated charts published on : British Telecom, ITV, Rolls Royce, Star Energy, Taylor Wimpey, Vodafone, Zoo Digital,
LSE:BT.A British Telecom Close Mid-Price: 105.3 Percentage Change: -1.63% Day High: 107.65 Day Low: 105.2
Continued weakness against BT.A taking the price below 105.2 calculates a ……..
</p
View Previous British Telecom & Big Picture ***
LSE:ITV ITV Close Mid-Price: 57.7 Percentage Change: -2.20% Day High: 59.38 Day Low: 57.58
In the event ITV experiences weakness below 57.58 it calculates with a dr ……..
</p
View Previous ITV & Big Picture ***
LSE:RR. Rolls Royce. Close Mid-Price: 322.9 Percentage Change: + 1.60% Day High: 324.6 Day Low: 316.9
Further movement against Rolls Royce ABOVE 324.6 should improve accelerat ……..
</p
View Previous Rolls Royce & Big Picture ***
LSE:STAR Star Energy Close Mid-Price: 7.47 Percentage Change: -3.92% Day High: 7.8 Day Low: 7.5
Continued weakness against STAR taking the price below 7.5 calculates as ……..
</p
View Previous Star Energy & Big Picture ***
LSE:TW. Taylor Wimpey. Close Mid-Price: 148.75 Percentage Change: + 1.16% Day High: 150.6 Day Low: 147.45
Target met. All Taylor Wimpey needs are mid-price trades ABOVE 151p to im ……..
</p
View Previous Taylor Wimpey & Big Picture ***
LSE:VOD Vodafone Close Mid-Price: 63.6 Percentage Change: -3.97% Day High: 65.95 Day Low: 63.77
In the event Vodafone experiences weakness below 63.77 it calculates with ……..
</p
View Previous Vodafone & Big Picture ***
LSE:ZOO Zoo Digital Close Mid-Price: 34.5 Percentage Change: -8.00% Day High: 37.5 Day Low: 34.5
Target met. Weakness on Zoo Digital below 34.5 will invariably lead to 24 ……..
</p
View Previous Zoo Digital & Big Picture ***