#Gold #SP500
A recent article about a father and daughter crew, piloting a Jet2 flight certainly gave pause for thought. Anytime my own daughter is behind the wheel of a car I’m in, I tend keep my eyes tightly shut. This is probably not an ideal scenario for the captain of a commercial passenger jet. My daughter, of course, prefers believe I find it easy to fall asleep, if she’s driving…
It’s been a while since we reviewed Jet2’s share price and admit it’s been performing quite strangely since February, perhaps not with sufficient erratic behaviour to force investors to close their eyes but undoubtedly, there’s something a bit funny going on. Though, broadly speaking, it’s been following a similar zombie trail to that followed by British Airways or EasyJet. The chart below tells a complex story.
Since February of this year, the share price broke upward through an obvious Blue downtrend and in the period since, effectively treated this trend line like it didn’t really matter. Except there’s a problem as during July, on two occasions, the market very deliberately chose to Gap (manipulate) the share price below this Blue line on two distinct occasions. As a result, we’re supposed to conclude this trend line may actually be important, thanks to the market confirming it isn’t a figment of our imagination!
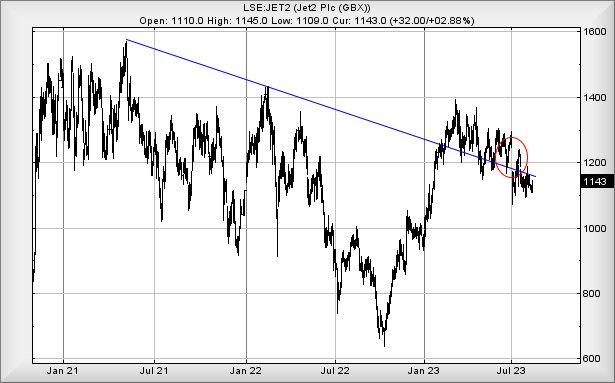
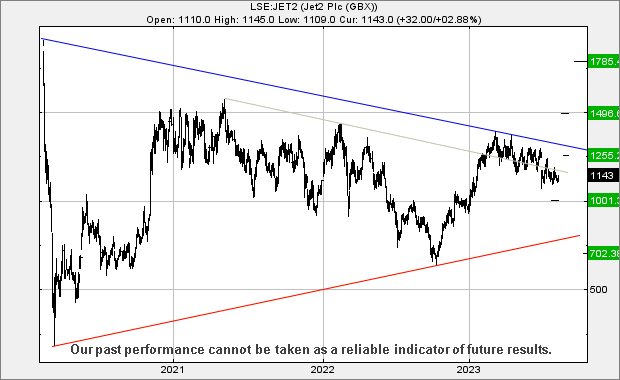
We’re at a bit of a loss as share price movements are generally calculated on how they perform in relation to trend lines and Jet2 are failing to play along. It makes sense to attempt discover just what’s needed to allow us to shoehorn price movements into our logic. Currently, above 1201p calculates as capable of a visit to 1255p, an area where some hesitation is expected. Should such a mild ascent occur, it will tick the first box in a logic pointing at share price recovery. Should our initial target of 1255p be bettered, things become interesting as the share price shall be viewed as entering a longer term cycle to 1496p. At such a level, the visual implication is game changing as it paints a new high, hopefully able to allow the share price to close above the glass ceiling which seems to have formed at the 14 quid level.
If things intend go wrong for Jet2, share price movements below 1100p risk triggering reversal to an initial 1001p and hopefully a rebound. If circumstances allow such a level to break, our secondary calculates at 702p, a sizeable drop we’d normally call ridiculous, were it not for share price movements less than a year ago!
FUTURES
| Time Issued | Market | Price At Issue | Short Entry | Fast Exit | Slow Exit | Stop | Long Entry | Fast Exit | Slow Exit | Stop | Prior |
| 9:47:13PM | BRENT | 8298.6 | Success | ||||||||
| 9:50:12PM | GOLD | 1892.6 | 1891 | 1871 | 1861 | 1907 | 1907 | 1913 | 1921 | 1896 | ‘cess |
| 9:53:41PM | FTSE | 7322.3 | ‘cess | ||||||||
| 9:56:33PM | STOX50 | 4260.5 | Shambles | ||||||||
| 9:58:56PM | GERMANY | 15718.4 | |||||||||
| 10:11:17PM | US500 | 4403.5 | 4401 | 4351 | 4266 | 4451 | 4451 | 4470 | 4493 | 4427 | Success |
| 10:14:12PM | DOW | 34786 | |||||||||
| 10:18:08PM | NASDAQ | 14870.9 | Success | ||||||||
| 10:22:08PM | JAPAN | 31657 | Success |
16/08/2023 FTSE Closed at 7356 points. Change of -0.45%. Total value traded through LSE was: £ 4,782,194,827 a change of 34.91%
15/08/2023 FTSE Closed at 7389 points. Change of -1.57%. Total value traded through LSE was: £ 3,544,639,764 a change of -13.22%
14/08/2023 FTSE Closed at 7507 points. Change of -0.23%. Total value traded through LSE was: £ 4,084,432,990 a change of -33.31%
11/08/2023 FTSE Closed at 7524 points. Change of -1.23%. Total value traded through LSE was: £ 6,124,601,431 a change of 49.97%
10/08/2023 FTSE Closed at 7618 points. Change of 0.41%. Total value traded through LSE was: £ 4,083,887,572 a change of -13.93%
9/08/2023 FTSE Closed at 7587 points. Change of 0.8%. Total value traded through LSE was: £ 4,744,774,883 a change of 3.35%
8/08/2023 FTSE Closed at 7527 points. Change of -0.36%. Total value traded through LSE was: £ 4,591,181,240 a change of 31.12%
SUCCESS above means both FAST & SLOW targets were met. ‘CESS means just the FAST target met and probably the next time it is exceeded, movement to the SLOW target shall commence.
Our commentary is in two sections. Immediately below are today’s updated comments. If our commentary remains valid, the share can be found in the bottom section which has a RED heading. Hopefully, this will mean you no longer need to flip back through previous reports. HYPERLINKS DISABLED IN THIS VERSION
Please remember, all prices are mid-price (halfway between the Buy and Sell). When we refer to a price CLOSING above a specific level, we are viewing the point where we can regard a trend as changing. Otherwise, we are simply speculating on near term trading targets. Our website is www.trendsandtargets.com.
UPDATE. We often give an initial and a secondary price. If the initial is exceeded, we still expect it to fall back but the next time the initial is bettered, the price should continue to the secondary. The converse it true with price drops.
We can be contacted at info@trendsandtargets.com. Spam filters set to maximum so only legit emails get through…
Section One – Outlook Updated Today. Click here for Section Two – Outlook Remains Valid shares
Click Epic to jump to share: LSE:BBY BALFOUR BEATTY** **LSE:BME B & M** **LSE:CEY Centamin** **LSE:CNA Centrica** **LSE:EXPN Experian** **LSE:EZJ EasyJet** **LSE:FRES Fresnillo** **LSE:GENL Genel** **LSE:GLEN Glencore Xstra** **LSE:MKS Marks and Spencer** **LSE:NWG Natwest** **LSE:OXIG Oxford Instruments** **LSE:TERN Tern Plc** **
********
Updated charts published on : BALFOUR BEATTY, B & M, Centamin, Centrica, Experian, EasyJet, Fresnillo, Genel, Glencore Xstra, Marks and Spencer, Natwest, Oxford Instruments, Tern Plc,
LSE:BBY BALFOUR BEATTY Close Mid-Price: 310 Percentage Change: -10.61% Day High: 355.8 Day Low: 296
Target met. Continued weakness against BBY taking the price below 296 cal ……..
</p
View Previous BALFOUR BEATTY & Big Picture ***
LSE:BME B & M. Close Mid-Price: 574.8 Percentage Change: + 1.70% Day High: 583 Day Low: 565.2
Further movement against B & M ABOVE 583 should improve acceleration towa ……..
</p
View Previous B & M & Big Picture ***
LSE:CEY Centamin Close Mid-Price: 87 Percentage Change: -1.69% Day High: 90.95 Day Low: 86.8
Continued weakness against CEY taking the price below 86.8 calculates as ……..
</p
View Previous Centamin & Big Picture ***
LSE:CNA Centrica. Close Mid-Price: 143.3 Percentage Change: + 0.92% Day High: 145.05 Day Low: 141.65
Continued trades against CNA with a mid-price ABOVE 145.05 should improve ……..
</p
View Previous Centrica & Big Picture ***
LSE:EXPN Experian Close Mid-Price: 2766 Percentage Change: -0.86% Day High: 2798 Day Low: 2748
Target met. If Experian experiences continued weakness below 2748, it wil ……..
</p
View Previous Experian & Big Picture ***
LSE:EZJ EasyJet. Close Mid-Price: 441.3 Percentage Change: + 0.52% Day High: 444.1 Day Low: 435
Weakness on EasyJet below 435 will invariably lead to 424 followed by a f ……..
</p
View Previous EasyJet & Big Picture ***
LSE:FRES Fresnillo Close Mid-Price: 513.6 Percentage Change: -2.36% Day High: 534 Day Low: 510.2
Target met. Continued weakness against FRES taking the price below 510.2 ……..
</p
View Previous Fresnillo & Big Picture ***
LSE:GENL Genel Close Mid-Price: 80.6 Percentage Change: -1.59% Day High: 82.5 Day Low: 79.9
Target met. Continued weakness against GENL taking the price below 79.9 c ……..
</p
View Previous Genel & Big Picture ***
LSE:GLEN Glencore Xstra. Close Mid-Price: 419.5 Percentage Change: + 0.11% Day High: 422.75 Day Low: 414.65
In the event Glencore Xstra experiences weakness below 414.65 it calculat ……..
</p
View Previous Glencore Xstra & Big Picture ***
LSE:MKS Marks and Spencer. Close Mid-Price: 231.6 Percentage Change: + 4.51% Day High: 231.8 Day Low: 222.7
Target met. Continued trades against MKS with a mid-price ABOVE 231.8 sho ……..
</p
View Previous Marks and Spencer & Big Picture ***
LSE:NWG Natwest Close Mid-Price: 226.4 Percentage Change: -3.08% Day High: 232.1 Day Low: 226
If Natwest experiences continued weakness below 226p, it will invariably ……..
</p
View Previous Natwest & Big Picture ***
LSE:OXIG Oxford Instruments Close Mid-Price: 2240 Percentage Change: -1.54% Day High: 2380 Day Low: 2220
Continued weakness against OXIG taking the price below 2220 calculates as ……..
</p
View Previous Oxford Instruments & Big Picture ***
LSE:TERN Tern Plc Close Mid-Price: 5 Percentage Change: -16.67% Day High: 5.5 Day Low: 4.75
In the event Tern Plc experiences weakness below 4.75 it calculates with ……..
</p
View Previous Tern Plc & Big Picture ***