#FTSE #Nasdaq This probably means something important and we’ve drawn our own conclusions. The price of Gold often fails to comply with our in-house logic when it’s heading upward. Yet, when downward, our projections are often devastatingly correct. Historically, once things get above the 2000 dollar level, it almost feels like a human somewhere has intervened and said “Nope!”. Obviously this is a silly concept in a free and fair marketplace.
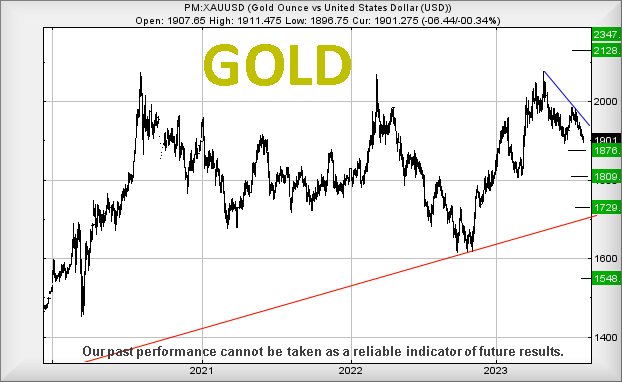
The chart below highlights the market has tended lose confidence in the price of the precious metal, virtually the moment it dares exceed an imaginary line. Curiously, in April of this year, for a moment we thought the price was going to get away with a rise and for 4 weeks, it finally “felt” like the price was indeed going to break upward. But when the surge arrived at the start of May, rather than accelerate above the 2100 level, for a mystery reason the price opted to discover the joys of spoiling the fun for all the folk who’d long positions and currently, we feel the dig downward hasn’t yet concluded.
However, it may be worth remembering the degree of mucking about during April tends suggest the imaginary ceiling at around 2070 dollars may be weakening. In fact, if the price now manages above 2077 dollars, conventional thinking suggests a 4th stab at the glass ceiling should break it, perhaps triggering movement to an initial 2128 with our secondary, if bettered, calculating at 2347 dollars. While these targets fail to align with the fantastic ambition of $3000 mentioned by industry ‘analysts’, these same experts have been predicting the three thousand dollar level since 2009.
For now, it feels like Gold has entered a reversal cycle, one where weakness next below $1896 risks triggering travel down to an initial 1876 dollars with secondary, if broken, working out at 1809. Usually we’d be happy to ridicule such a secondary but visually, the metal was trading at such a level last March and therefore, such an ambition is liable to be far from stupid. In fact, glancing at the chart, it actually makes quite a bit of sense.
We’ve displayed our target levels below 1809, should everything go wrong. Surprisingly, neither of them make much visual sense, so we currently distrust the calculations.
FUTURES
| Time Issued | Market | Price At Issue | Short Entry | Fast Exit | Slow Exit | Stop | Long Entry | Fast Exit | Slow Exit | Stop | Prior |
| 9:16:52PM | BRENT | 8459 | Success | ||||||||
| 9:20:05PM | GOLD | 1902.36 | ‘cess | ||||||||
| 9:32:19PM | FTSE | 7383.5 | 7368 | 7346 | 7254 | 7427 | 7437 | 7456 | 7485 | 7400 | Success |
| 9:34:44PM | STOX50 | 4274 | ‘cess | ||||||||
| 9:48:34PM | GERMANY | 15732 | ‘cess | ||||||||
| 10:24:56PM | US500 | 4436.9 | ‘cess | ||||||||
| 10:27:55PM | DOW | 34949 | Success | ||||||||
| 10:30:52PM | NASDAQ | 15043.8 | 15030 | 15021 | 14940 | 31839 | 15144 | 15189 | 15248 | 15080 | |
| 10:33:25PM | JAPAN | 31915 | ‘cess |
15/08/2023 FTSE Closed at 7389 points. Change of -1.57%. Total value traded through LSE was: £ 3,544,639,764 a change of -13.22%
14/08/2023 FTSE Closed at 7507 points. Change of -0.23%. Total value traded through LSE was: £ 4,084,432,990 a change of -33.31%
11/08/2023 FTSE Closed at 7524 points. Change of -1.23%. Total value traded through LSE was: £ 6,124,601,431 a change of 49.97%
10/08/2023 FTSE Closed at 7618 points. Change of 0.41%. Total value traded through LSE was: £ 4,083,887,572 a change of -13.93%
9/08/2023 FTSE Closed at 7587 points. Change of 0.8%. Total value traded through LSE was: £ 4,744,774,883 a change of 3.35%
8/08/2023 FTSE Closed at 7527 points. Change of -0.36%. Total value traded through LSE was: £ 4,591,181,240 a change of 31.12%
7/08/2023 FTSE Closed at 7554 points. Change of -0.13%. Total value traded through LSE was: £ 3,501,608,401 a change of -4.09%
SUCCESS above means both FAST & SLOW targets were met. ‘CESS means just the FAST target met and probably the next time it is exceeded, movement to the SLOW target shall commence.
Our commentary is in two sections. Immediately below are today’s updated comments. If our commentary remains valid, the share can be found in the bottom section which has a RED heading. Hopefully, this will mean you no longer need to flip back through previous reports. HYPERLINKS DISABLED IN THIS VERSION
Please remember, all prices are mid-price (halfway between the Buy and Sell). When we refer to a price CLOSING above a specific level, we are viewing the point where we can regard a trend as changing. Otherwise, we are simply speculating on near term trading targets. Our website is www.trendsandtargets.com.
UPDATE. We often give an initial and a secondary price. If the initial is exceeded, we still expect it to fall back but the next time the initial is bettered, the price should continue to the secondary. The converse it true with price drops.
We can be contacted at info@trendsandtargets.com. Spam filters set to maximum so only legit emails get through…
Section One – Outlook Updated Today. Click here for Section Two – Outlook Remains Valid shares
Click Epic to jump to share: LSE:AV. Aviva** **LSE:BME B & M** **LSE:CEY Centamin** **LSE:CNA Centrica** **LSE:EMG MAN** **LSE:EXPN Experian** **LSE:EZJ EasyJet** **LSE:FGP Firstgroup** **LSE:GENL Genel** **LSE:GLEN Glencore Xstra** **LSE:IQE IQE** **LSE:ITM ITM Power** **LSE:MKS Marks and Spencer** **LSE:NG. National Glib** **LSE:OXIG Oxford Instruments** **
********
Updated charts published on : Aviva, B & M, Centamin, Centrica, MAN, Experian, EasyJet, Firstgroup, Genel, Glencore Xstra, IQE, ITM Power, Marks and Spencer, National Glib, Oxford Instruments,
LSE:AV. Aviva Close Mid-Price: 379.9 Percentage Change: -1.02% Day High: 384.9 Day Low: 376.5
Weakness on Aviva below 376.5 will invariably lead to 374 with secondary ……..
</p
View Previous Aviva & Big Picture ***
LSE:BME B & M. Close Mid-Price: 565.2 Percentage Change: + 2.02% Day High: 567.2 Day Low: 554
Continued trades against BME with a mid-price ABOVE 567.2 should improve ……..
</p
View Previous B & M & Big Picture ***
LSE:CEY Centamin Close Mid-Price: 88.5 Percentage Change: -1.61% Day High: 90 Day Low: 88.3
Weakness on Centamin below 87p will invariably lead to 82p with secondary ……..
</p
View Previous Centamin & Big Picture ***
LSE:CNA Centrica Close Mid-Price: 142 Percentage Change: -0.04% Day High: 142.5 Day Low: 140.55
In the event of Centrica enjoying further trades beyond 142.5, the share ……..
</p
View Previous Centrica & Big Picture ***
LSE:EMG MAN Close Mid-Price: 212.1 Percentage Change: -1.03% Day High: 217 Day Low: 210.7
Continued weakness against EMG taking the price below 210.7 calculates as ……..
</p
View Previous MAN & Big Picture ***
LSE:EXPN Experian Close Mid-Price: 2790 Percentage Change: -2.65% Day High: 2868 Day Low: 2779
In the event Experian experiences weakness below 2779 it calculates with ……..
</p
View Previous Experian & Big Picture ***
LSE:EZJ EasyJet Close Mid-Price: 439 Percentage Change: -1.53% Day High: 446.6 Day Low: 437.6
If EasyJet experiences continued weakness below 437.6, it will invariably ……..
</p
View Previous EasyJet & Big Picture ***
LSE:FGP Firstgroup Close Mid-Price: 155.1 Percentage Change: -0.32% Day High: 158.6 Day Low: 150
Target met. All Firstgroup needs are mid-price trades ABOVE 158.6 to impr ……..
</p
View Previous Firstgroup & Big Picture ***
LSE:GENL Genel Close Mid-Price: 81.9 Percentage Change: -3.87% Day High: 86.1 Day Low: 81.6
Weakness on Genel below 81.6 will invariably lead to 79p with secondary ( ……..
</p
View Previous Genel & Big Picture ***
LSE:GLEN Glencore Xstra Close Mid-Price: 419.05 Percentage Change: -3.40% Day High: 433.45 Day Low: 417
Target met. Continued weakness against GLEN taking the price below 417p c ……..
</p
View Previous Glencore Xstra & Big Picture ***
LSE:IQE IQE Close Mid-Price: 18.16 Percentage Change: -3.71% Day High: 18.6 Day Low: 18.1
In the event IQE experiences weakness below 18.1 it calculates with a dro ……..
</p
View Previous IQE & Big Picture ***
LSE:ITM ITM Power. Close Mid-Price: 97 Percentage Change: + 0.92% Day High: 99 Day Low: 94.68
In the event of ITM Power enjoying further trades beyond 99, the share sh ……..
</p
View Previous ITM Power & Big Picture ***
LSE:MKS Marks and Spencer. Close Mid-Price: 221.6 Percentage Change: + 8.26% Day High: 224.5 Day Low: 213.8
Target met. Further movement against Marks and Spencer ABOVE 224.5 should ……..
</p
View Previous Marks and Spencer & Big Picture ***
LSE:NG. National Glib Close Mid-Price: 960 Percentage Change: -1.56% Day High: 974 Day Low: 954.4
If National Glib experiences continued weakness below 954.4, it will inva ……..
</p
View Previous National Glib & Big Picture ***
LSE:OXIG Oxford Instruments Close Mid-Price: 2275 Percentage Change: -1.52% Day High: 2345 Day Low: 2265
Weakness on Oxford Instruments below 2265 will invariably lead to 2185p w ……..
</p
View Previous Oxford Instruments & Big Picture ***