#FTSE #Gold
There’s a need for a word to describe a new social phenomena. It used to be the case, when you bump into someone you’d smile and exchange the usual greetings. Nowadays, there’s a different greeting, the “ear tap” as folk frantically try to mute whatever is playing in their earpiece before they speak. Since falling victim to cordless ear buds at Xmas, it eventually dawned most people struggle at shutting the things down, the desperation for silence increasingly provoking an awkward ear dance as folk completely forget the ear piece can simply be removed.
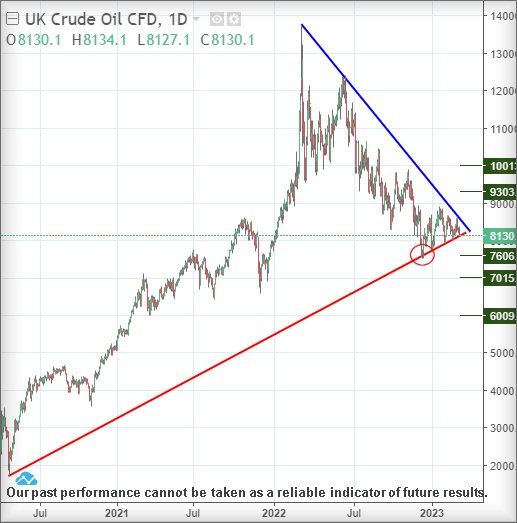
There’s a degree of similarity with Brent crude currently, two lines converging on a chart with the market looking unable to decide what to do!
On the chart below, there’s the Red line since the gory days of 2020. The price of Brent has been struggling with this uptrend since last December, frantically trying not to break it and thus giving the markets a clue as to direction. And then there is the Blue line since a year ago, the artificial high blamed on Moscow but in reality, it was a trend which commenced a year earlier when the price of crude oil managed to exceed the cost of Brent crude, pre-pandemic. While the Russia thing undoubtedly caused a spike, the uptrend was absolutely nothing to do with hostilities in Ukraine. The visuals below tell their own story.
There’s a tiny little circled area on the chart, a point where intraday traffic pierced the Red line during two sessions but extreme case was taken to ensure the value of Brent crude closed above Red on the 8th and 9th December last year. This may be taken as early warning for future trouble, the market conceding the uptrend can be broken during a session but also extremely careful to ensure the uptrend remained in place. The implication, should we take this as a signal for danger, is a suggestion where weakness now below just $80.7 should trigger oil to drip down to 76.5 next with secondary, if broken, at 70 dollars. We’d be inclined to anticipate a bounce at the 70 dollar level, given such a drop ambition matches the high before the pandemic happened. There’s absolutely no logic we can suggest where this would make any sense, it’s just how things sometimes work.
Our alternate scenario for a gain is simply based on arithmetic.
Should Brent manage to somehow drip upwards, it now needs above $88 to suggest coming travel to $93 with secondary, if bettered, at $100.
Finally, there’s something else we need to mention. The chart visuals imply Brent crude should be forced to make a defining movement anytime in the next week or so, due to the convergence of the two trend lines. There’s absolutely no rule which demands this shall happen and sometimes, commonly with AIM shares which are awaiting important news, a share price will boringly drift through the trend lines and continue bumbling along which doing nothing useful. But in the case of Brent, should it stumble below 80.7 dollars, a short looks logical, one with a pretty tight stop.
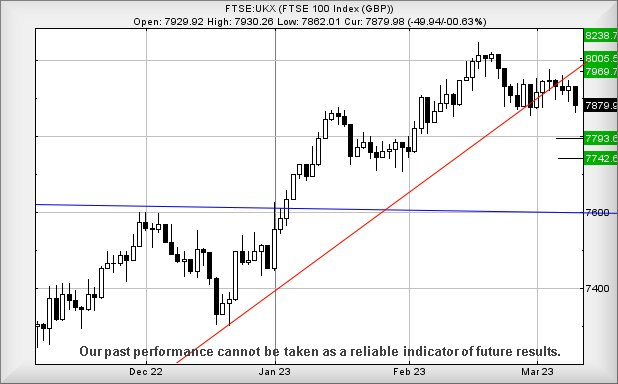
FTSE for FRIDAY Given the FTSE has been effectively becalmed for the last few weeks, it’s increasingly uncomfortable trying to get a feel of market direction but, as usual, we’ll give it a stab! At time of writing, the index (always remember, we’re talking the FTSE 100, not after hours futures) is at 7879 points, needing below 7859 points to risk triggering reversal to an initial 7793 points with secondary, if broken, down at 7742 points and visually a rebound. We fairly relaxed at these relaxation potentials as the index needs below 7600 points (Blue) before justifying panic. If triggered, the tightest stop loss level looks like 7900 points.
Our alternate scenario for a market gain seems pretty straightforward as above 7920 looks capable of triggering movement to an initial modest 7969 points with secondary, if bettered, a more useful 8005 points.
Have a good weekend.
FUTURES
| Time Issued | Market | Price At Issue | Short Entry | Fast Exit | Slow Exit | Stop | Long Entry | Fast Exit | Slow Exit | Stop | Prior |
| 10:17:29PM | BRENT | 81.34 | 81.2 | 80.81 | 82.3 | 83.78 | 84.32 | 82.6 | |||
| 10:20:09PM | GOLD | 1830.82 | 1812 | 1806 | 1821 | 1837 | 1842 | 1827 | ‘cess | ||
| 10:22:50PM | FTSE | 7821.35 | 7806 | 7791 | 7850 | 7898 | 7933 | 7860 | Success | ||
| 10:25:08PM | STOX50 | 4238.5 | 4227 | 4218 | 4247 | 4268 | 4275 | 4244 | ‘cess | ||
| 10:48:15PM | GERMANY | 15499.54 | 15474 | 15403 | 15563 | 15667 | 15735 | 15570 | |||
| 10:51:33PM | US500 | 3915.42 | 3907 | 3888 | 3933 | 3965 | 3970 | 3936 | ‘cess | ||
| 10:59:38PM | DOW | 32230.6 | 32146 | 31995 | 32352 | 32560 | 32668 | 32315 | Success | ||
| 11:02:18PM | NASDAQ | 11981 | 11964 | 11904 | 12112 | 12144 | 12190 | 12044 | Success | ||
| 11:05:06PM | JAPAN | 29032 | 28206 | 28081 | 28417 | 28729 | 28779 | 28458 |
9/03/2023 FTSE Closed at 7879 points. Change of -0.63%. Total value traded through LSE was: £ 6,576,891,587 a change of 1.82%
8/03/2023 FTSE Closed at 7929 points. Change of 0.13%. Total value traded through LSE was: £ 6,459,565,037 a change of 19.23%
7/03/2023 FTSE Closed at 7919 points. Change of -0.13%. Total value traded through LSE was: £ 5,417,813,576 a change of -3.92%
6/03/2023 FTSE Closed at 7929 points. Change of -0.23%. Total value traded through LSE was: £ 5,638,585,361 a change of -4.78%
3/03/2023 FTSE Closed at 7947 points. Change of 0.04%. Total value traded through LSE was: £ 5,921,700,262 a change of -13.69%
2/03/2023 FTSE Closed at 7944 points. Change of 34.33%. Total value traded through LSE was: £ 6,861,176,489 a change of -1.62%
1/03/2023 FTSE Closed at 5914 points. Change of -24.91%. Total value traded through LSE was: £ 6,974,404,128 a change of -21.96%
SUCCESS above means both FAST & SLOW targets were met. ‘CESS means just the FAST target met and probably the next time it is exceeded, movement to the SLOW target shall commence.
Our commentary is in two sections. Immediately below are today’s updated comments. If our commentary remains valid, the share can be found in the bottom section which has a RED heading. Hopefully, this will mean you no longer need to flip back through previous reports. HYPERLINKS DISABLED IN THIS VERSION
Please remember, all prices are mid-price (halfway between the Buy and Sell). When we refer to a price CLOSING above a specific level, we are viewing the point where we can regard a trend as changing. Otherwise, we are simply speculating on near term trading targets. Our website is www.trendsandtargets.com.
UPDATE. We often give an initial and a secondary price. If the initial is exceeded, we still expect it to fall back but the next time the initial is bettered, the price should continue to the secondary. The converse it true with price drops.
We can be contacted at info@trendsandtargets.com. Spam filters set to maximum so only legit emails get through…
Section One – Outlook Updated Today. Click here for Section Two – Outlook Remains Valid shares
Click Epic to jump to share: LSE:AV. Aviva** **LSE:BARC Barclays** **LSE:GKP Gulf Keystone** **LSE:GLEN Glencore Xstra** **LSE:IQE IQE** **LSE:OCDO Ocado Plc** **LSE:OPG OPG Power Ventures** **LSE:RKH Rockhopper** **LSE:RR. Rolls Royce** **LSE:TLW Tullow** **LSE:TSCO Tesco** **
********
Updated charts published on : Aviva, Barclays, Gulf Keystone, Glencore Xstra, IQE, Ocado Plc, OPG Power Ventures, Rockhopper, Rolls Royce, Tullow, Tesco,
LSE:AV. Aviva. Close Mid-Price: 462.4 Percentage Change: + 2.73% Day High: 467.3 Day Low: 458.9
Further movement against Aviva ABOVE 467.3 should improve acceleration to ……..
</p
View Previous Aviva & Big Picture ***
LSE:BARC Barclays Close Mid-Price: 163.42 Percentage Change: -3.23% Day High: 167.72 Day Low: 162.36
Weakness on Barclays below 162.36 will invariably lead to 158 with second ……..
</p
View Previous Barclays & Big Picture ***
LSE:GKP Gulf Keystone Close Mid-Price: 192.4 Percentage Change: -4.99% Day High: 201 Day Low: 186.6
Continued weakness against GKP taking the price below 186.6 calculates as ……..
</p
View Previous Gulf Keystone & Big Picture ***
LSE:GLEN Glencore Xstra Close Mid-Price: 473.4 Percentage Change: -2.76% Day High: 486.45 Day Low: 471.25
In the event Glencore Xstra experiences weakness below 471.25 it calculat ……..
</p
View Previous Glencore Xstra & Big Picture ***
LSE:IQE IQE Close Mid-Price: 29 Percentage Change: -37.97% Day High: 37.65 Day Low: 29.3
If IQE experiences continued weakness below 29.3, it will invariably lead ……..
</p
View Previous IQE & Big Picture ***
LSE:OCDO Ocado Plc Close Mid-Price: 482.6 Percentage Change: -4.32% Day High: 502.6 Day Low: 484.3
If Ocado Plc experiences continued weakness below 484.3, it will invariab ……..
</p
View Previous Ocado Plc & Big Picture ***
LSE:OPG OPG Power Ventures. Close Mid-Price: 9.8 Percentage Change: + 8.89% Day High: 9.8 Day Low: 9.4
All OPG Power Ventures needs are mid-price trades ABOVE 9.8 to improve ac ……..
</p
View Previous OPG Power Ventures & Big Picture ***
LSE:RKH Rockhopper. Close Mid-Price: 11 Percentage Change: + 5.26% Day High: 11.4 Day Low: 10.5
Target met. Continued trades against RKH with a mid-price ABOVE 11.4 shou ……..
</p
View Previous Rockhopper & Big Picture ***
LSE:RR. Rolls Royce. Close Mid-Price: 158.04 Percentage Change: + 0.75% Day High: 160 Day Low: 155.18
All Rolls Royce needs are mid-price trades ABOVE 160 to improve accelerat ……..
</p
View Previous Rolls Royce & Big Picture ***
LSE:TLW Tullow. Close Mid-Price: 32.74 Percentage Change: + 3.94% Day High: 33.26 Day Low: 30.2
Target met. Continued weakness against TLW taking the price below 30.2 ca ……..
</p
View Previous Tullow & Big Picture ***
LSE:TSCO Tesco. Close Mid-Price: 262.8 Percentage Change: + 0.88% Day High: 262.7 Day Low: 259.8
Continued trades against TSCO with a mid-price ABOVE 262.7 should improve ……..
</p
View Previous Tesco & Big Picture ***