#Gold #SP500 Ranked as one of The Big Seven supermajor oil companies, Total Energies enjoy a Wikipedia page worth a visit for anyone wanting to lose 30 minutes in fascination. Currently, their logo no longer shows on Formula1 cars but, perhaps Russian military aircraft exhibit it. Total are the only remaining western “major” operating in Russia, apparently supplying a refinery which produces jet fuel for warplanes!
However, as is usually the case with long established corporate entities (Total were founded in 1924), our favourite section of the Wikipedia page is “Controversies”, this always being the part where a companies squeaky clean image is sullied by uncomfortable historical facts. It’s almost summed up quite neatly by a study last year which surmised;
“‘They’ ultimately settled on a position in the late 1990s of publicly accepting climate science, while still promoting doubt and trying to delay climate action.”
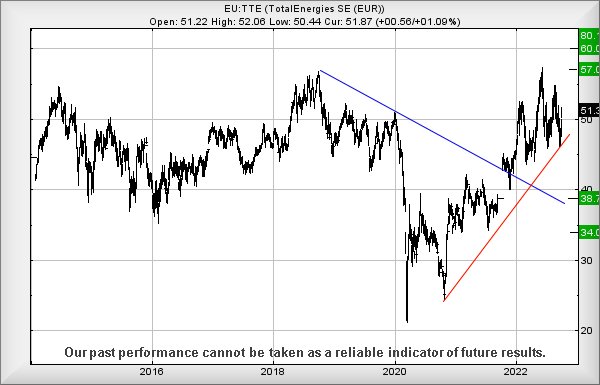
As for their share price, Total appear poised to experience some gains.
At time of writing, the share was trading around 51.3€, needing only exceed 52.1€ to trigger the potential of gains toward an initial 57. Visually, there’s a fairly plausible suggestion of some hesitation at such a point, due to it matching historical highs. But should the 57 Euro level be exceeded, a visit to 60€ calculates as possible, perhaps taking the share price into a region where some longer term “game changing” potentials become possible. Currently, we can scratch in 80€ as a rough potential but realistically, shall need revisit the numbers should the 60 Euro ambition be fulfilled.
If everything intends go pear shaped for Total, the share price needs slip below 45 as this risks promoting reversal down to an initial 38€ with secondary, if broken, down at the 34€ mark and hopefully a resounding bounce. (Suggested by the visual implications)
For the present, we suspect Total intends share price gains.
FUTURES
| Time Issued | Market | Price At Issue | Short Entry | Fast Exit | Slow Exit | Stop | Long Entry | Fast Exit | Slow Exit | Stop | Prior |
| 9:48:29PM | BRENT | 93.34 | Success | ||||||||
| 9:50:12PM | GOLD | 1716 | 1695 | 1686 | 1673 | 1714 | 1730 | 1739 | 1752 | 1717 | |
| 9:52:04PM | FTSE | 7054 | ‘cess | ||||||||
| 9:53:43PM | STOX50 | 3472 | |||||||||
| 9:55:27PM | GERMANY | 12592 | |||||||||
| 9:57:09PM | US500 | 3782 | 3720 | 3692 | 3654 | 3755 | 3806 | 3818 | 3832 | 3766 | |
| 9:59:48PM | DOW | 30276 | |||||||||
| 10:02:18PM | NASDAQ | 11567.07 | ‘cess | ||||||||
| 10:04:18PM | JAPAN | 27057 | ‘cess |
5/10/2022 FTSE Closed at 7052 points. Change of -0.48%. Total value traded through LSE was: £ 5,488,765,319 a change of -9.96%
4/10/2022 FTSE Closed at 7086 points. Change of 2.58%. Total value traded through LSE was: £ 6,096,244,319 a change of 12.65%
3/10/2022 FTSE Closed at 6908 points. Change of 0.22%. Total value traded through LSE was: £ 5,411,543,289 a change of -20.03%
30/09/2022 FTSE Closed at 6893 points. Change of 0.17%. Total value traded through LSE was: £ 6,766,933,974 a change of -4.67%
29/09/2022 FTSE Closed at 6881 points. Change of -1.77%. Total value traded through LSE was: £ 7,098,757,750 a change of -12.95%
28/09/2022 FTSE Closed at 7005 points. Change of 0.3%. Total value traded through LSE was: £ 8,154,391,132 a change of 17.78%
27/09/2022 FTSE Closed at 6984 points. Change of -0.51%. Total value traded through LSE was: £ 6,923,595,633 a change of 5.34%
SUCCESS above means both FAST & SLOW targets were met. ‘CESS means just the FAST target met and probably the next time it is exceeded, movement to the SLOW target shall commence.
Our commentary is in two sections. Immediately below are today’s updated comments. If our commentary remains valid, the share can be found in the bottom section which has a RED heading. Hopefully, this will mean you no longer need to flip back through previous reports. HYPERLINKS DISABLED IN THIS VERSION
Please remember, all prices are mid-price (halfway between the Buy and Sell). When we refer to a price CLOSING above a specific level, we are viewing the point where we can regard a trend as changing. Otherwise, we are simply speculating on near term trading targets. Our website is www.trendsandtargets.com.
UPDATE. We often give an initial and a secondary price. If the initial is exceeded, we still expect it to fall back but the next time the initial is bettered, the price should continue to the secondary. The converse it true with price drops.
We can be contacted at info@trendsandtargets.com. Spam filters set to maximum so only legit emails get through…
Section One – Outlook Updated Today. Click here for Section Two – Outlook Remains Valid shares
Click Epic to jump to share: LSE:AML Aston Martin** **LSE:ASC Asos** **LSE:NG. National Glib** **LSE:PHP Primary Health** **LSE:SBRY Sainsbury** **
********
Updated charts published on : Aston Martin, Asos, National Glib, Primary Health, Sainsbury,
LSE:AML Aston Martin Close Mid-Price: 101.65 Percentage Change: -5.49% Day High: 110.25 Day Low: 100.8
Target met. If Aston Martin experiences continued weakness below 100.8, i ……..
</p
View Previous Aston Martin & Big Picture ***
LSE:ASC Asos Close Mid-Price: 559.5 Percentage Change: -5.49% Day High: 600 Day Low: 545
Weakness on Asos below 545 will invariably lead to 516 with secondary (if ……..
</p
View Previous Asos & Big Picture ***
LSE:NG. National Glib Close Mid-Price: 924.8 Percentage Change: -0.71% Day High: 937.2 Day Low: 912.8
If National Glib experiences continued weakness below 912.8, it will inva ……..
</p
View Previous National Glib & Big Picture ***
LSE:PHP Primary Health Close Mid-Price: 106.3 Percentage Change: -4.41% Day High: 113.4 Day Low: 105.2
In the event Primary Health experiences weakness below 105.2 it calculate ……..
</p
View Previous Primary Health & Big Picture ***
LSE:SBRY Sainsbury Close Mid-Price: 172.2 Percentage Change: -4.65% Day High: 182.4 Day Low: 170.75
If Sainsbury experiences continued weakness below 170.75, it will invaria ……..
</p
View Previous Sainsbury & Big Picture ***