#Gold #Nasdaq
Our previous report on ITM in November 2019 has proven quite extraordinary. We’d the courage to show some future targets on the illustrative charts but opted to “bottle it” in the text. To be honest, the only thing which permitted movement from 80p to 248p was a calculation, rather than any specific chart logic. Not only did the price reach 248p, it was gapped above this level in 2020 and somehow made its way to 724p eventually!
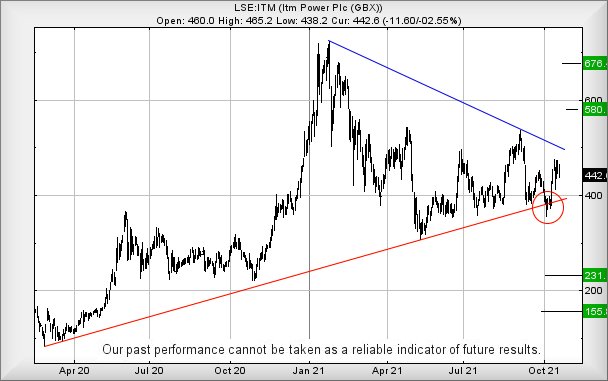
We had been impressed at the company technological Hydrogen Cell base and it certainly appears the market was equally fascinated. However, on the chart below, we’ve circled something which bothers us a little. Since March 2020, there has been a pretty solidly defined uptrend and earlier this month, the share price briefly spiked below the uptrend. As we’ve mentioned previously, this sort of one session event can often be taken as a warning signal, the market essentially broadcasting the uptrend cannot be trusted.
If this is indeed the case, weakness next below 356p risks promoting trouble, allowing reversal to an initial 231p with secondary, if broken, calculating at a bottom of 155p. Visually, there are plenty of arguments favouring a bounce at the 231p level.
Perhaps we’re being too negative, reading too much into whatever happened on October 6th!
Presently trading around 442p, the share price now needs exceed 479p as this, allegedly, should trigger price recovery to 580p. If playing safe, waiting until the share price closes above Blue (currently 504p), should make some sense. Our longer term secondary, should 580p be exceeded, works out at 676p. The chart visuals suggest some hesitation at such a level.
Yet again, serious thanks to the folk who find adverts on this page so interesting. Google certainly seem to do their job, publishing decent content to ensure we’re kept in coffee!
FUTURES
| Time Issued | Market | Price At Issue | Short Entry | Fast Exit | Slow Exit | Stop | Long Entry | Fast Exit | Slow Exit | Stop | Prior |
| 9:42:46PM | BRENT | 85.39 | ‘cess | ||||||||
| 9:44:52PM | GOLD | 1781.78 | 1769 | 1767 | 1760 | 1781 | 1789 | 1794 | 1803 | 1773 | ‘cess |
| 9:46:41PM | FTSE | 7216.08 | |||||||||
| 9:48:27PM | FRANCE | 6707.5 | Success | ||||||||
| 9:50:55PM | GERMANY | 15507.82 | ‘cess | ||||||||
| 9:54:35PM | US500 | 4533.87 | |||||||||
| 9:56:29PM | DOW | 35564 | Success | ||||||||
| 9:58:20PM | NASDAQ | 15373.72 | 15332 | 15293 | 15238 | 15400 | 15462 | 15488 | 15540 | 15378 | |
| 10:00:49PM | JAPAN | 29241 |
20/10/2021 FTSE Closed at 7223 points. Change of 0.08%. Total value traded through LSE was: £ 5,182,365,180 a change of -1.88%
19/10/2021 FTSE Closed at 7217 points. Change of 0.19%. Total value traded through LSE was: £ 5,281,678,962 a change of 1.68%
18/10/2021 FTSE Closed at 7203 points. Change of -0.43%. Total value traded through LSE was: £ 5,194,650,270 a change of -14.83%
15/10/2021 FTSE Closed at 7234 points. Change of 0.37%. Total value traded through LSE was: £ 6,099,387,832 a change of 10.37%
14/10/2021 FTSE Closed at 7207 points. Change of 0.92%. Total value traded through LSE was: £ 5,526,155,922 a change of -16.32%
13/10/2021 FTSE Closed at 7141 points. Change of 0.15%. Total value traded through LSE was: £ 6,604,225,806 a change of 15.2%
12/10/2021 FTSE Closed at 7130 points. Change of -0.22%. Total value traded through LSE was: £ 5,733,075,032 a change of 19.23%
SUCCESS above means both FAST & SLOW targets were met. ‘CESS means just the FAST target met and probably the next time it is exceeded, movement to the SLOW target shall commence.
Our commentary is in two sections. Immediately below are today’s updated comments. If our commentary remains valid, the share can be found in the bottom section which has a RED heading. Hopefully, this will mean you no longer need to flip back through previous reports. HYPERLINKS DISABLED IN THIS VERSION
Please remember, all prices are mid-price (halfway between the Buy and Sell). When we refer to a price CLOSING above a specific level, we are viewing the point where we can regard a trend as changing. Otherwise, we are simply speculating on near term trading targets. Our website is www.trendsandtargets.com.
UPDATE. We often give an initial and a secondary price. If the initial is exceeded, we still expect it to fall back but the next time the initial is bettered, the price should continue to the secondary. The converse it true with price drops.
We can be contacted at info@trendsandtargets.com. Spam filters set to maximum so only legit emails get through…
Section One – Outlook Updated Today. Click here for Section Two – Outlook Remains Valid shares
Click Epic to jump to share: LSE:ASC Asos** **LSE:CAR Carclo** **LSE:CBX Cellular Goods** **LSE:CNA Centrica** **LSE:ECO ECO (Atlantic) O & G** **LSE:EZJ EasyJet** **LSE:FRES Fresnillo** **LSE:HUR Hurrican Energy** **LSE:IAG British Airways** **LSE:IQE IQE** **LSE:OXIG Oxford Instruments** **
********
Updated charts published on : Asos, Carclo, Cellular Goods, Centrica, ECO (Atlantic) O & G, EasyJet, Fresnillo, Hurrican Energy, British Airways, IQE, Oxford Instruments,
LSE:ASC Asos. Close Mid-Price: 2661 Percentage Change: + 4.76% Day High: 2721 Day Low: 2495
Continued trades against ASC with a mid-price ABOVE 2721 should improve t ……..
</p
View Previous Asos & Big Picture ***
LSE:CAR Carclo. Close Mid-Price: 36 Percentage Change: + 10.09% Day High: 35.5 Day Low: 32.1
Needing above 37, this looks capable of movement to an initial 41.5 with s ……..
</p
View Previous Carclo & Big Picture ***
LSE:CBX Cellular Goods Close Mid-Price: 6.8 Percentage Change: -1.45% Day High: 6.85 Day Low: 6.72
Continued weakness against CBX taking the price below 6.72 calculates as ……..
</p
View Previous Cellular Goods & Big Picture ***
LSE:CNA Centrica. Close Mid-Price: 60.22 Percentage Change: + 2.94% Day High: 61.1 Day Low: 58.78
In the event of Centrica enjoying further trades beyond 61.1, the share s ……..
</p
View Previous Centrica & Big Picture ***
LSE:ECO ECO (Atlantic) O & G. Close Mid-Price: 33.2 Percentage Change: + 9.57% Day High: 34.25 Day Low: 30.5
All ECO (Atlantic) O & G needs are mid-price trades ABOVE 34.25 to improv ……..
</p
View Previous ECO (Atlantic) O & G & Big Picture ***
LSE:EZJ EasyJet Close Mid-Price: 591.2 Percentage Change: -3.59% Day High: 614.8 Day Low: 581.8
This is looking increasingly dodgy as below 580 indicates coming reversal ……..
</p
View Previous EasyJet & Big Picture ***
LSE:FRES Fresnillo. Close Mid-Price: 897.4 Percentage Change: + 1.10% Day High: 899.8 Day Low: 883
All Fresnillo needs are mid-price trades ABOVE 899.8 to improve accelerat ……..
</p
View Previous Fresnillo & Big Picture ***
LSE:HUR Hurrican Energy. Close Mid-Price: 4.8 Percentage Change: + 10.34% Day High: 4.7 Day Low: 4.2
If this will trade above 5.09, it now calculates with the potential of 6.4 ……..
</p
View Previous Hurrican Energy & Big Picture ***
LSE:IAG British Airways Close Mid-Price: 157.5 Percentage Change: -4.87% Day High: 165.78 Day Low: 156.04
If British Airways experiences continued weakness below 152, it will inv ……..
</p
View Previous British Airways & Big Picture ***
LSE:IQE IQE Close Mid-Price: 44 Percentage Change: -1.01% Day High: 45.6 Day Low: 44.05
Weakness on IQE below 43.5 will invariably lead to 40p next. If broken, s ……..
</p
View Previous IQE & Big Picture ***
LSE:OXIG Oxford Instruments Close Mid-Price: 2340 Percentage Change: -2.50% Day High: 2455 Day Low: 2360
If this intends trouble, below 2175 will do it, allowing reversal to 1779 ……..
</p
View Previous Oxford Instruments & Big Picture ***