#FreeFridayFutures There’s something quite curious happening with the major US indices. The S&P 500 recently achieved logical high levels, one of these points in time where we tend suspect some volatility will be required, prior to a future lift. Wall St, on the other hand, has not yet achieved the level we’d expect the markets to throw a bit of a wobble and it’s creating a pretty vague situation.
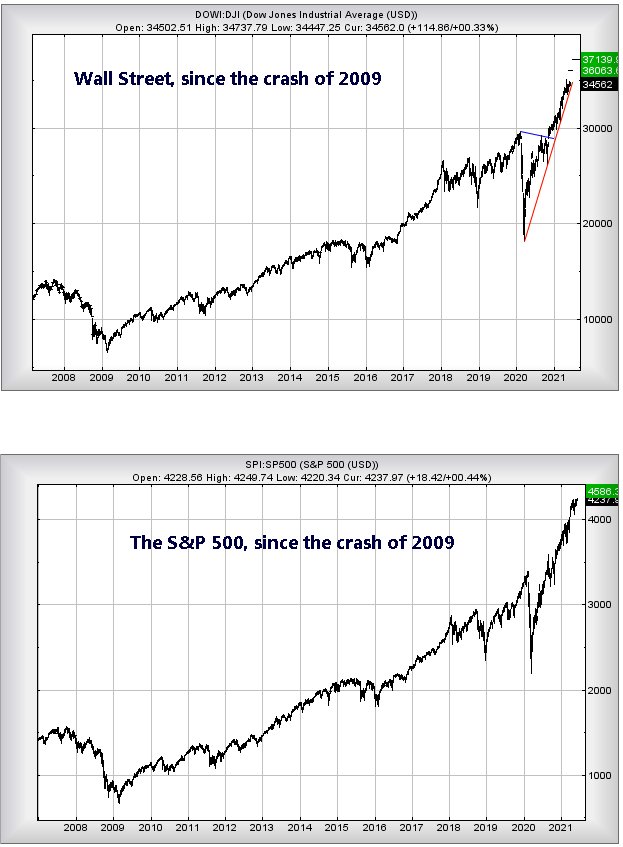
Our problem is simple. We calculated 4,265 as a level where some hesitation was expected on the S&P, the index essentially fluttering a few points below this level for the last month. Currently the market exhibits no signs of impending disaster, just a rigid refusal to actually climb higher. On the other hand, Wall St, still has a fair bit of climbing to match the current strength of the S&P, needing to reach a stonking 36,063 points.
The question is fairly simple. Will Wall St discover sufficient oomph for a further 1,000 point gain while the S&P continues to waffle around? Or will the S&P achieve some slight gains, should Wall St start to power upward. We’ve decided to set above 4,265 as a major trigger event for the S&P. Above this level looks capable of a lift to 4,333 points initially with secondary, if exceeded, calculating at 4,586 along with some very possible hesitation.
Wall St, conversely, needs above a trigger of 35,290 to suggest impending growth coming to an initial 36,063 points. If bettered (and cannot believe we’re writing this), our secondary works out at an impossible sounding 37,139 points. Similar to the S&P, we anticipate some market volatility should such a level appear.
The charts below highlight the brutal strength of the two US indices since the crash of 2009. Had the two markets moved in sympathy with the UK market, the highest they would have achieved by now would by 17,000 points for Wall St and 2,100 points for the S&P. Instead, for every step upward in the UK, the two primary US markets have taken 2 steps, a quite dreadful situation given the FTSE and the DOW JONES were regarded as joined at the hip until the financial crash of 2009.
As for our FTSE for FRIDAY, despite the UK market (and others) appears to take a “watch and wait” stance since the start of May, we keep feeling slight touches of optimism, a bit like seeing green shoots between paving slabs, a few days prior to a bunch of weeds suddenly surging upward. It begs the question, who’s got the weed killer for the FTSE to crush hope?
Will it be Covid-19, Boris, space aliens, or the ongoing Brexit shambles?
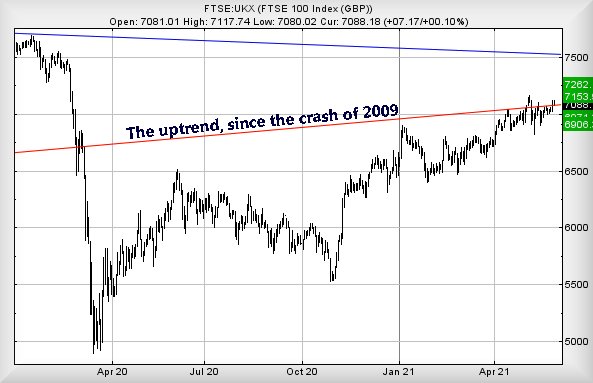
At time of writing, the FTSE is trading around 7,090 points and only requires exceed 7,122 as this will apparently trigger a surge in the direction of 7,153 points. If bettered, we’d hope to see our secondary calculation of 7,262 pretty fast thereafter. Or at least, in normal times we would. As the chart below displays with boring clarity, the FTSE continues to pole dance along the Red uptrend, a line which dates back to the lows of 2009 and the market crash. Those folk of a nervous disposition will doubtless only be convinced any upward break is real, if the FTSE finds an excuse to better its prior high of 7,164 points, achieved last month on May 10th.
Our converse scenario for the FTSE suggests the index needs trade below 7,040 points to justify some near term concern. This is liable to trigger reversals to an initial 6,971 points. If broken, our secondary calculates at 6,906 and the visuals hint at a bounce, should such a level make an appearance.
FUTURES
| Time Issued | Market | Price At Issue | Short Entry | Fast Exit | Slow Exit | Stop | Long Entry | Fast Exit | Slow Exit | Stop | Prior |
| 9:19:38PM | BRENT | 72.26 | 71.13 | 70.6 | 72.12 | 72.7 | 73.35 | 71.85 | Success | ||
| 9:22:30PM | GOLD | 1898.3 | 1883 | 1879 | 1893 | 1899 | 1905 | 1886 | Success | ||
| 9:29:03PM | FTSE | 7085.54 | 7068 | 7053.5 | 7098 | 7118 | 7134 | 7074 | ‘cess | ||
| 9:57:06PM | FRANCE | 6550 | 6532 | 6517.5 | 6562 | 6570 | 6580 | 6540 | |||
| 9:58:38PM | GERMANY | 15586 | 15512 | 15467.5 | 15596 | 15640 | 15670.5 | 15547 | |||
| 10:00:31PM | US500 | 4239 | 4212 | 4204 | 4226 | 4245 | 4252 | 4224 | Success | ||
| 10:05:12PM | DOW | 34472 | 34396 | 34295.5 | 34534 | 34660 | 34786 | 34500 | Success | ||
| 10:07:18PM | NASDAQ | 13973 | 13810 | 13749 | 13944 | 13974 | 14001 | 13807 | Success | ||
| 10:09:06PM | JAPAN | 28949 | 28858 | 28783 | 29050 | 29135 | 29187 | 28935 | Success |
10/06/2021 FTSE Closed at 7088 points. Change of 0.1%. Total value traded through LSE was: £ 4,968,352,767 a change of 1.13%
9/06/2021 FTSE Closed at 7081 points. Change of -0.2%. Total value traded through LSE was: £ 4,913,059,029 a change of 3.4%
8/06/2021 FTSE Closed at 7095 points. Change of 0.25%. Total value traded through LSE was: £ 4,751,728,118 a change of 8.88%
7/06/2021 FTSE Closed at 7077 points. Change of 0.11%. Total value traded through LSE was: £ 4,364,121,178 a change of 7.1%
4/06/2021 FTSE Closed at 7069 points. Change of 0.07%. Total value traded through LSE was: £ 4,074,732,159 a change of -14.11%
3/06/2021 FTSE Closed at 7064 points. Change of -0.62%. Total value traded through LSE was: £ 4,744,036,832 a change of -6.04%
2/06/2021 FTSE Closed at 7108 points. Change of -100%. Total value traded through LSE was: £ 5,048,977,038 a change of 0%
SUCCESS above means both FAST & SLOW targets were met. ‘CESS means just the FAST target met and probably the next time it is exceeded, movement to the SLOW target shall commence.
Our commentary is in two sections. Immediately below are today’s updated comments. If our commentary remains valid, the share can be found in the bottom section which has a RED heading. Hopefully, this will mean you no longer need to flip back through previous reports. HYPERLINKS DISABLED IN THIS VERSION
Please remember, all prices are mid-price (halfway between the Buy and Sell). When we refer to a price CLOSING above a specific level, we are viewing the point where we can regard a trend as changing. Otherwise, we are simply speculating on near term trading targets. Our website is www.trendsandtargets.com.
UPDATE. We often give an initial and a secondary price. If the initial is exceeded, we still expect it to fall back but the next time the initial is bettered, the price should continue to the secondary. The converse it true with price drops.
We can be contacted at info@trendsandtargets.com. Spam filters set to maximum so only legit emails get through…
Section One – Outlook Updated Today. Click here for Section Two – Outlook Remains Valid shares
Click Epic to jump to share: LSE:AGM Applied Graphene** **LSE:BT.A British Telecom** **LSE:CAR Carclo** **LSE:DGE Diageo** **LSE:EMG MAN** **LSE:HL. Hargreaves Lansdown** **LSE:SDY Speedyhire** **LSE:SPX Spirax** **LSE:TW. Taylor Wimpey** **LSE:ZOO Zoo Digital** **
********
Updated charts published on : Applied Graphene, British Telecom, Carclo, Diageo, MAN, Hargreaves Lansdown, Speedyhire, Spirax, Taylor Wimpey, Zoo Digital,
LSE:AGM Applied Graphene Close Mid-Price: 29 Percentage Change: -3.33% Day High: 29 Day Low: 27.5
In the event Applied Graphene experiences weakness below 27.5 it calculat ……..
</p
View Previous Applied Graphene & Big Picture ***
LSE:BT.A British Telecom. Close Mid-Price: 195.15 Percentage Change: + 6.55% Day High: 198.15 Day Low: 184.5
Target met. Further movement against British Telecom ABOVE 198.15 should ……..
</p
View Previous British Telecom & Big Picture ***
LSE:CAR Carclo Close Mid-Price: 53 Percentage Change: -8.62% Day High: 56 Day Low: 51.8
Weakness on Carclo below 51.8 will invariably lead to 40p. Secondary is a ……..
</p
View Previous Carclo & Big Picture ***
LSE:DGE Diageo Close Mid-Price: 3457 Percentage Change: -0.09% Day High: 3472.5 Day Low: 3435.5
Target met. Further movement against Diageo ABOVE 3472.5 should improve a ……..
</p
View Previous Diageo & Big Picture ***
LSE:EMG MAN. Close Mid-Price: 181.25 Percentage Change: + 0.11% Day High: 183.7 Day Low: 177.5
In the event of MAN enjoying further trades beyond 183.7, the share shoul ……..
</p
View Previous MAN & Big Picture ***
LSE:HL. Hargreaves Lansdown Close Mid-Price: 1620 Percentage Change: -1.43% Day High: 1645 Day Low: 1592.5
In the event Hargreaves Lansdown experiences weakness below 1592.5 it cal ……..
</p
View Previous Hargreaves Lansdown & Big Picture ***
LSE:SDY Speedyhire. Close Mid-Price: 71.7 Percentage Change: + 0.00% Day High: 72.4 Day Low: 71.6
The situation now is of movement below 66p ringing alarm bells as this ris ……..
</p
View Previous Speedyhire & Big Picture ***
LSE:SPX Spirax. Close Mid-Price: 13030 Percentage Change: + 0.04% Day High: 13135 Day Low: 12990
Further movement against Spirax ABOVE 13135 should improve acceleration t ……..
</p
View Previous Spirax & Big Picture ***
LSE:TW. Taylor Wimpey Close Mid-Price: 163.45 Percentage Change: -2.24% Day High: 168.05 Day Low: 163.5
Continued weakness against TW. taking the price below 163.5 calculates as ……..
</p
View Previous Taylor Wimpey & Big Picture ***
LSE:ZOO Zoo Digital Close Mid-Price: 148.5 Percentage Change: -0.67% Day High: 153.5 Day Low: 148
Target met. In the event of Zoo Digital enjoying further trades beyond 15 ……..
</p
View Previous Zoo Digital & Big Picture ***