#Brent #SP500 It wasn’t difficult to find inspiration for tonight’s headline article. After driving a neighbour* 9 miles to the ferry terminal at 8am, the need to buy milk ensured a stop at a local village shop, a tiny little store with a post-office, selling groceries, fishing tackle, newspapers, welly boots, and booze. It even boasts parking spaces for 2 cars, both mercifully empty, and I pulled in. While paying for the milk, there was the sound of air-brakes outside as a fuel tanker double parked, blocking my exit.
*(Calling a taxi isn’t an option in the remote highlands. Their meters move faster than Bitcoin, when it reverses.)
As I left the shop, the tanker driver entered with a ‘just be a minute’ as he walked past.
His word proved good, he quickly appeared with a newspaper and soft drink. I started my engine, looking forward to my usual scan of the markets at the open while I try and figure out what the markets intend, prior to publishing our popular “Live Market” report sometime around 9.30am. The truck started its engine, lurched forward quite dramatically, the cab seemed to jump up a bit, and the air-brakes make an incredible noise. Then everything went quiet.
Long story short, it seems HGV’s have some sort of system to lock the brakes when parked and this HGV was refusing to disengage the mechanism. In front of me, a red post box ensured I couldn’t bump onto the pavement. To the rear, the parking area was lined with concrete bollards, so my car was trapped. When the driver finished his phone calls, he advised it would take some time for a repair crew to come across from the mainland. Making matters worse, my own mobile phone was on charge, beside my keyboard on my desk. My wallet was in my waxed cotton jacket, hanging on the back of my chair. I’d grabbed spare change from the car ashtray to buy the milk.
As I was now only around 4 miles from home, a brisk walk was ahead, smug in the knowledge I was in the highlands and we help each other. Invariably, someone would stop and ask if I wanted a lift. Unfortunately, this sort of thing only happens when you don’t need a lift. Cars driving past at 60mph, now in light rain, the concept of walking was feeling increasingly stupid. The final insult came just as my house came into view, my wife finally noticing I wasn’t around and exiting the driveway to search for me. She’d noticed my abandoned mobile phone and put two and two together. By now, I was utterly soaked, had forgotten to pick up the milk from the car, and was substantially late with publication of our futures report.
About the only bright thing from the exercise was the tanker. Tonight, I was going to write about a petrol company and there was a fair chance I would be quite spiteful.
For BP Plc, it’s always worth remembering the thick Red line on the chart. While we’d like to ridicule a trend line 30 years old, share price movements tend suggest the market is perfectly aware of this splash of colour on the chart. It creates a trading environment where the share price ‘Ultimate Bottom’ computes down at 29p and thanks to this calculation, share price drops can easily outperform with some dreadful amateur dramatics.
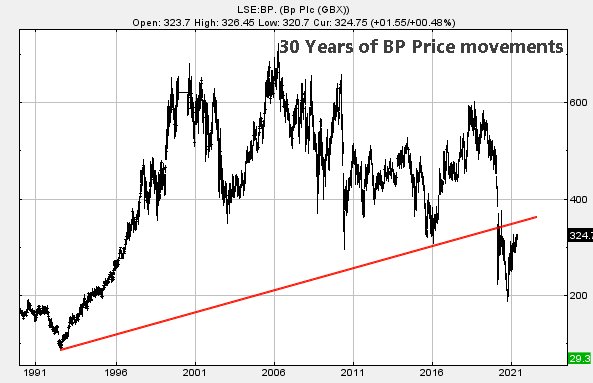
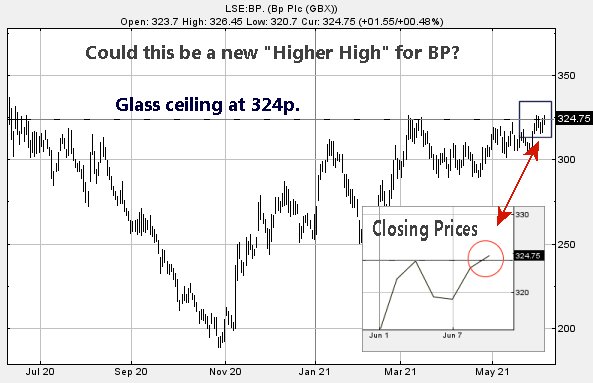
Our inclination is to believe the market shall become aware of this danger, hopefully opting to enact some panic recovery as is so often the case with such things. Given the current boost to Crude Oil prices, surely it’s about time oiler share prices started to enjoy the benefits of increased sale values too. With this in mind, something about recent share price movements is worth a glance. Despite our expectation of being negative on future prospects, BP has built itself a little glass ceiling in the last year at 324p and we notice today, 9th May, the share price finally closed a session above this level at 324.75p. While perhaps not the most significant of movements, we’re always inclined to optimism when a share is permitted to break a glass ceiling.
In the case of BP, as the chart below highlights, it’s perhaps an early warning for some proper price action.
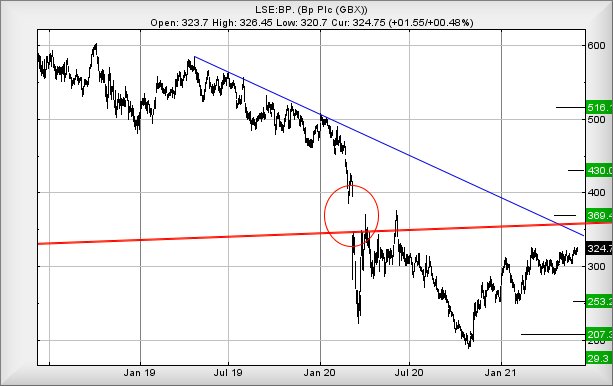
Finally, we reach the part of the story where we must run some calculations for the long term. If the price movement on 9th May was indeed an early warning for happier times, we need explore whether recovery above the long term Red uptrend is a viable ambition. Equally, should we anticipate action which reflects the immediate Blue downtrend since 2019?
It appears the answer to both questions should be “Yes”.
Near term trades bettering just 330p should make recovery difficult to restrain as we’re calculating the potential of movement to an initial 369p. As shown below, this will marginally take the price above Red on the chart and into a zone of illusory safety. We’d hope our initial calculation would be exceeded with this scenario, making our longer term secondary target of 430p an extremely viable ambition. Movement beyond such a level starts to produce some surprising targets, the first of which works out at 516p and challenging the price highs prior to the pandemic hitting the fan.
Finally, there is an aspect of BP’s dance steps over the last 18 months which is worthy of additional consideration.
We’ve drawn a pretty circle on the chart below. Our idea of perfection would come, if the market somehow found sufficient excuse to “Gap Up” the share price at some point soon. This will create a “GapDown/GapUp” picture, a game plan which should make BP a perfect candidate for a hold, just to see how high the price intends go. It’s a thought!
FUTURES
| Time Issued | Market | Price At Issue | Short Entry | Fast Exit | Slow Exit | Stop | Long Entry | Fast Exit | Slow Exit | Stop | Prior |
| 10:42:26PM | BRENT | 71.88 | 71.6 | 71.47 | 71.06 | 72.3 | 72.7 | 72.885 | 73.66 | 71.75 | ‘cess |
| 10:45:06PM | GOLD | 1888.8 | |||||||||
| 10:50:56PM | FTSE | 7083.97 | ‘cess | ||||||||
| 10:52:52PM | FRANCE | 6564.9 | Shambles | ||||||||
| 10:56:09PM | GERMANY | 15583.61 | Success | ||||||||
| 10:57:46PM | US500 | 4222.72 | 4219 | 4215 | 4208 | 4232 | 4236 | 4245 | 4258 | 4224 | |
| 11:01:16PM | DOW | 34479.2 | ‘cess | ||||||||
| 11:03:28PM | NASDAQ | 13821 | |||||||||
| 11:05:22PM | JAPAN | 28850 | Success |
9/06/2021 FTSE Closed at 7081 points. Change of -0.2%. Total value traded through LSE was: £ 4,913,059,029 a change of 3.4%
8/06/2021 FTSE Closed at 7095 points. Change of 0.25%. Total value traded through LSE was: £ 4,751,728,118 a change of 8.88%
7/06/2021 FTSE Closed at 7077 points. Change of 0.11%. Total value traded through LSE was: £ 4,364,121,178 a change of 7.1%
4/06/2021 FTSE Closed at 7069 points. Change of 0.07%. Total value traded through LSE was: £ 4,074,732,159 a change of -14.11%
3/06/2021 FTSE Closed at 7064 points. Change of -0.62%. Total value traded through LSE was: £ 4,744,036,832 a change of -6.04%
2/06/2021 FTSE Closed at 7108 points. Change of 0.4%. Total value traded through LSE was: £ 5,048,977,038 a change of -2.93%
1/06/2021 FTSE Closed at 7080 points. Change of -100%. Total value traded through LSE was: £ 5,201,214,939 a change of 0%
SUCCESS above means both FAST & SLOW targets were met. ‘CESS means just the FAST target met and probably the next time it is exceeded, movement to the SLOW target shall commence.
Our commentary is in two sections. Immediately below are today’s updated comments. If our commentary remains valid, the share can be found in the bottom section which has a RED heading. Hopefully, this will mean you no longer need to flip back through previous reports. HYPERLINKS DISABLED IN THIS VERSION
Please remember, all prices are mid-price (halfway between the Buy and Sell). When we refer to a price CLOSING above a specific level, we are viewing the point where we can regard a trend as changing. Otherwise, we are simply speculating on near term trading targets. Our website is www.trendsandtargets.com.
UPDATE. We often give an initial and a secondary price. If the initial is exceeded, we still expect it to fall back but the next time the initial is bettered, the price should continue to the secondary. The converse it true with price drops.
We can be contacted at info@trendsandtargets.com. Spam filters set to maximum so only legit emails get through…
Section One – Outlook Updated Today. Click here for Section Two – Outlook Remains Valid shares
Click Epic to jump to share: LSE:BLOE Block Energy PLC** **LSE:BP. BP PLC** **LSE:CCL Carnival** **LSE:DGE Diageo** **LSE:FOXT Foxtons** **LSE:IHG Intercontinental Hotels Group** **LSE:ODX Omega Diags** **LSE:RR. Rolls Royce** **LSE:TW. Taylor Wimpey** **LSE:ZOO Zoo Digital** **
********
Updated charts published on : Block Energy PLC, BP PLC, Carnival, Diageo, Foxtons, Intercontinental Hotels Group, Omega Diags, Rolls Royce, Taylor Wimpey, Zoo Digital,
LSE:BLOE Block Energy PLC. Close Mid-Price: 2.9 Percentage Change: + 13.73% Day High: 3.2 Day Low: 2.55
Target met. Further movement against Block Energy PLC ABOVE 3.2 should im ……..
</p
View Previous Block Energy PLC & Big Picture ***
LSE:BP. BP PLC. Close Mid-Price: 324.75 Percentage Change: + 0.48% Day High: 326.45 Day Low: 320.7
I’ve used BP as the headline article and suggest taking it pretty seriousl ……..
</p
View Previous BP PLC & Big Picture ***
LSE:CCL Carnival. Close Mid-Price: 1865.4 Percentage Change: + 0.76% Day High: 1890.2 Day Low: 1853.4
All Carnival needs are mid-price trades ABOVE 1890.2 to improve accelerat ……..
</p
View Previous Carnival & Big Picture ***
LSE:DGE Diageo. Close Mid-Price: 3460 Percentage Change: + 1.30% Day High: 3462.5 Day Low: 3399
Continued trades against DGE with a mid-price ABOVE 3462.5 should improve ……..
</p
View Previous Diageo & Big Picture ***
LSE:FOXT Foxtons Close Mid-Price: 58 Percentage Change: -1.02% Day High: 60.9 Day Low: 56.6
If Foxtons experiences continued weakness below 56.6, it will invariably ……..
</p
View Previous Foxtons & Big Picture ***
LSE:IHG Intercontinental Hotels Group. Close Mid-Price: 5210 Percentage Change: + 0.85% Day High: 5254 Day Low: 5150
In the event of Intercontinental Hotels Group enjoying further trades bey ……..
</p
View Previous Intercontinental Hotels Group & Big Picture ***
LSE:ODX Omega Diags Close Mid-Price: 59 Percentage Change: -3.28% Day High: 61 Day Low: 58.5
If Omega Diags experiences continued weakness below 58.5, it will invaria ……..
</p
View Previous Omega Diags & Big Picture ***
LSE:RR. Rolls Royce. Close Mid-Price: 112.56 Percentage Change: + 1.04% Day High: 113.14 Day Low: 110.32
All Rolls Royce needs are mid-price trades ABOVE 113.14 to improve accele ……..
</p
View Previous Rolls Royce & Big Picture ***
LSE:TW. Taylor Wimpey Close Mid-Price: 167.2 Percentage Change: -1.68% Day High: 170.15 Day Low: 165.75
Weakness on Taylor Wimpey below 165.75 will invariably lead to 159 with s ……..
</p
View Previous Taylor Wimpey & Big Picture ***
LSE:ZOO Zoo Digital. Close Mid-Price: 149.5 Percentage Change: + 5.65% Day High: 149.5 Day Low: 141.5
Target met. All Zoo Digital needs are mid-price trades ABOVE 149.5 to imp ……..
</p
View Previous Zoo Digital & Big Picture ***