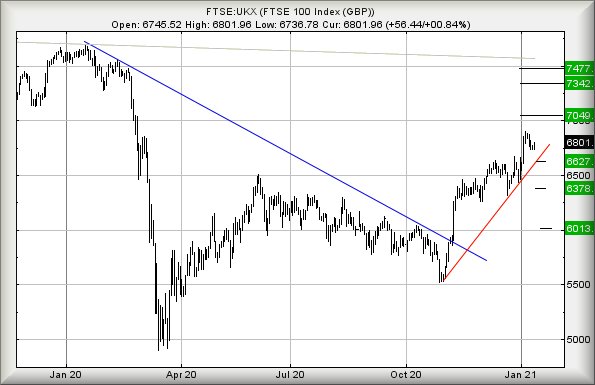
#FTSE #Gold January has, thus far, proven fairly resilient with the FTSE despite plenty of reasons for contrary behaviour. We wonder how much of this can be attributed to a market achieving a series of ‘Higher Highs’ and breaking above a pretty firm downtrend? There generally comes a point in trading, when the strength of a trend becomes difficult to resist, creating scenario where a share price or index will move in a direction which defies logic.
In the case of the FTSE, there are some pretty impressive potentials currently showing and we’ve little choice but to anticipate the FTSE discovering a reason to move above 6,904 points and once again give sufficient reason for a further upswing. When a market is enjoying an uptrend, it’s pretty difficult to define the movement when the trend changes direction unless it’s one of these catastrophe falls, provoked by a major event. Our favourite method in this type of guessing game creates a series of contrary calculations and when these outlooks start to be fulfilled, we’re generally correct in believing a trend is changing. Unfortunately, this sort of thing will often involve giving trigger levels which shall be perceived as ‘miles away’ from the immediate market price.
For instance, the FTSE (trading around 6,790 at time of writing) needs fail below 6,689 to give the first indication the UK market may be slipping out of its uptrend. Weakness such as this permits reversal to an initial 6,627 points, along with a challenge of the immediate uptrend. Things become sharply dodgy, should 6,627 break as a further reversal cycle toward 6,378 is very possible.
Amazingly, London needs drop below 5,888 points to utterly confirm the upward break is ‘fake’, something visually unlikely. Unless perhaps we are greeted with front page news of Boris riding his bike through a sick children Covid-19 ward, wearing a Jimmy Saville t-shirt, Trump baseball cap and waving the EU flag. The current strength of the marketplace signals something seriously negative will be required to dissuade this FTSE from its climbing cycle.
The other side of this coin must examine what to anticipate, should the FTSE next manage above 6,904 points?
Apparently we should anticipate further market recovery toward an initial 7,049 points. If exceeded, our ‘longer term’ secondary (please remember our tenuous grasp of timeframes) calculates at 7,342, visually reaching the height of the FTSE before UK incompetence killed over 100,000 people.
FUTURES
| Time Issued | Market | Price At Issue | Short Entry | Fast Exit | Slow Exit | Stop | Long Entry | Fast Exit | Slow Exit | Stop | Prior |
| 10:27:19PM | BRENT | 56.48 | 55.37 | 54.91 | 56.17 | 56.53 | 56.655 | 56.1 | ‘cess | ||
| 10:29:51PM | GOLD | 1846.75 | 1828 | 1808 | 1846 | 1858 | 1862.5 | 1843 | Success | ||
| 10:32:47PM | FTSE | 6801.54 | 6737 | 6705 | 6773 | 6811 | 6817.75 | 6786 | ‘cess | ||
| 10:34:51PM | FRANCE | 5672 | 5654 | 5643 | 5678 | 5686 | 5694.5 | 5660 | ‘cess | ||
| 10:37:31PM | GERMANY | 13975 | 13938 | 13913.5 | 14000 | 14028 | 14058.75 | 13939 | ‘cess | ||
| 10:39:27PM | US500 | 3798.37 | 3784 | 3774 | 3814 | 3825 | 3833.5 | 3808 | ‘cess | ||
| 10:53:09PM | DOW | 31034.2 | 30987 | 30923.5 | 31076 | 31222 | 31312 | 31072 | ‘cess | ||
| 10:55:33PM | NASDAQ | 12921 | 12883 | 12819 | 12986 | 13039 | 13068.25 | 12940 | |||
| 10:57:15PM | JAPAN | 28817 | 28561 | 28486 | 28780 | 28975 | 29009.5 | 28787 | Success |