#Gold #SP500 Such is our confidence in market direction, we’re opting to take a weekly review of the 2 leading shares in the retail bank sector in the hope of getting a clue what’s happening. Unlike Brent & Gold, the banking sector has tended avoid flamboyant movements since the Covid-19 drop, so we hope it shall prove a bellwether (the leading sheep in a flock) for future market direction.
The cunning plan is to try and identify a near term movements, capable of triggering a Big Picture movement. Unfortunately, the downward spike at the open of business for this week doesn’t feel capable of giving fireworks, instead probably just keeping the share price messing around to convince the market it’s trading. This strategy tends accomplish very little, other than to give a feel for change in market direction. What’s utterly key is the signal given, if one of our near term movements is substantially bettered. This sort of thing can often imply the first real signal for shift in market trend.
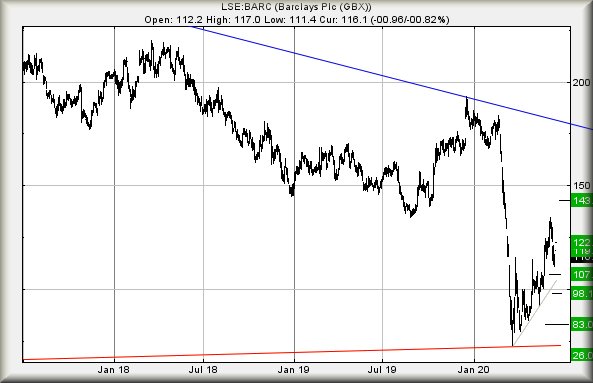
On an immediate basis, apparently moves next above 117p should provide a climb to an initial 119p with secondary, if exceeded, calculating at 122p. As the chart below highlights, neither ambition is particularly useful in itself, the price not being lifted into the land of Higher Highs. Instead, such a gain just keeps the share price marching on the spot.
Normally, a spike down on a price at the start of a trading week should give some hope but in the case of Barclays, we’re not sold. The price only needs drift below 111p to suggest coming weakness to an initial 107p with secondary, when broken, working out at 98p and hopefully some sort of rebound. The bigger problem comes should the share close below 98p for any reason as best hope for a bottom works out at 83p.
Next week, we shall again review what’s happening with Lloyds Bank.
FUTURES
| Time Issued | Market | Price At Issue | Short Entry | Fast Exit | Slow Exit | Stop | Long Entry | Fast Exit | Slow Exit | Stop | Prior |
| 10:07:50PM | BRENT | 39.94 | |||||||||
| 10:09:42PM | GOLD | 1725.69 | 1716 | 1711 | 1705 | 1724 | 1730 | 1734 | 1744 | 1717 | Success |
| 10:13:02PM | FTSE | 6148.85 | Shambles | ||||||||
| 10:26:05PM | FRANCE | 4877 | ‘cess | ||||||||
| 10:30:39PM | GERMANY | 12123 | ‘cess | ||||||||
| 10:45:03PM | US500 | 3080.02 | 2962 | 2880 | 2762 | 3050 | 3081 | 3108 | 3166 | 2996 | ‘cess |
| 10:48:34PM | DOW | 25871.5 | Success | ||||||||
| 10:52:53PM | NASDAQ | 9826.37 | Success | ||||||||
| 10:55:24PM | JAPAN | 21950 | Success |
15/06/2020 FTSE Closed at 6064 points. Change of -0.67%. Total value traded through LSE was: £ 4,968,429,954 a change of -16.12%
12/06/2020 FTSE Closed at 6105 points. Change of 0.48%. Total value traded through LSE was: £ 5,923,571,843 a change of -4.84%
11/06/2020 FTSE Closed at 6076 points. Change of -4%. Total value traded through LSE was: £ 6,224,767,909 a change of 0.67%
10/06/2020 FTSE Closed at 6329 points. Change of -0.14%. Total value traded through LSE was: £ 6,183,586,009 a change of -20.17%
9/06/2020 FTSE Closed at 6338 points. Change of -2.07%. Total value traded through LSE was: £ 7,746,073,267 a change of -2.7%
8/06/2020 FTSE Closed at 6472 points. Change of -0.19%. Total value traded through LSE was: £ 7,960,814,062 a change of 13.86%
5/06/2020 FTSE Closed at 6484 points. Change of 2.26%. Total value traded through LSE was: £ 6,991,891,155 a change of 13.09%