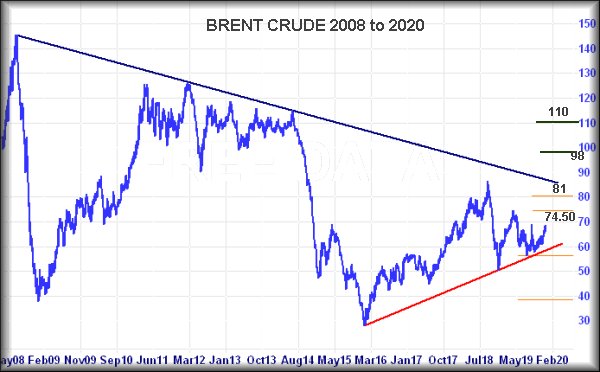
#BRENT #Gold #SP500 Few market signals are more useful than “the drop dead obvious”. Moves such as this become self fulfilling prophecies, simply due to the sheer volume of people watching an indicator, each believing they are the only one being clever. At present, Brent Crude exhibits such a sense of nonsense, thanks to the downtrend since 2008.
This trend line (shown below in BLUE) has been pretty firmly respected over the years and it’d be mad to think the current surge in the price of crude shall not face being derailed by the trend. Presently, this 12 year old line, ageing like a decent malt, needs the price of the black glop to exceed 86 dollars to suggest oil prices are about to go slightly crazy. Of course, the risk of further conflict in the Middle East is always going to be capable of provoking an interesting market. Essentially, above 86 dollars calculates with an initial ambition at 98 with secondary, if exceeded, a longer term 110 dollars. Surprisingly, a ceiling around 110 dollars makes for a very logical picture on the chart.
Alas, this appears unlikely given moves since the start of this year. Now above 71 dollars suggests growth to 74.50 and some hesitation, given prior highs. If exceeded, our secondary calculates at 81 dollars, an ambition unable to break the ruling downtrend anytime soon. Can we be the only folk wondering whether, thanks to 2019’s terrorism attack on a Saudi refinery failing to give a lasting boost to oil, we’re now witnessing another artificial (aside from those directly involved) attempt to ignite prices to new highs.
Of course, perhaps we’re just becoming too cynical. But if Brent somehow manages below 60 dollars anytime soon, it remains with the prospect of a bottom at 39 dollars.
|
Time Issued |
Market |
Price At Issue |
Short Entry |
Fast Exit |
Slow Exit |
Stop |
Long Entry |
Fast Exit |
Slow Exit |
Stop |
Prior |
|
10:50:27PM |
BRENT |
68.34 |
‘cess | ||||||||
|
10:52:50PM |
GOLD |
1566.19 |
1560 |
1555 |
1544 |
1580 |
1582 |
1589.5 |
1599 |
1566 | |
|
10:56:17PM |
FTSE |
7583.4 |
‘cess | ||||||||
|
10:58:47PM |
FRANCE |
6023.5 |
‘cess | ||||||||
|
11:01:55PM |
GERMANY |
13149 |
‘cess | ||||||||
|
11:04:01PM |
US500 |
3242.62 |
3228 |
3220.5 |
3211 |
3238 |
3249 |
3255.25 |
3262 |
3238 | |
|
11:06:44PM |
DOW |
28667 |
‘cess | ||||||||
|
11:11:14PM |
NASDAQ |
8839.37 | |||||||||
|
11:19:22PM |
JAPAN |
23330 |
‘cess |
6/01/2020 FTSE Closed at 7575 points. Change of -0.62%. Total value traded through LSE was: £ 4,720,635,792 a change of 20.67%
3/01/2020 FTSE Closed at 7622 points. Change of 0.46%. Total value traded through LSE was: £ 3,912,167,844 a change of 21.73%
30/12/2019 FTSE Closed at 7587 points. Change of -100%. Total value traded through LSE was: £ 3,213,676,764 a change of 0%
27/12/2019 FTSE Closed at 7644 points. Change of 0%. Total value traded through LSE was: £ 2,906,900,069 a change of 0%

30/12/2019 FTSE Closed at 7587 points. Change of -100%. Total value traded through LSE was: £ 3,213,676,764 a change of 0%
27/12/2019 FTSE Closed at 7644 points. Change of 0%. Total value traded through LSE was: £ 2,906,900,069 a change of 0%