The S&P 500 #CAC40 #Nasdaq #SP500 The S&P has been interesting since the original Brexit vote. For no discernable reason, it reacted to the UK’s decision and exhibited a strong uptrend in the period since. At least, it did until last December, when it all went wrong for a month. Now, it’s a happy index!
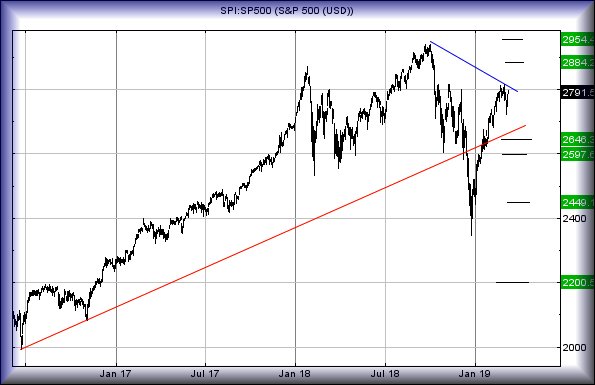
This is the stock market, a place where there’s no such thing as a “sure thing”. But oddly, the S&P has repeatedly painted a picture, daring traders to become excited if the market trades above 2820 points. Essentially, one of the most glassy of glass ceilings has formed at such a level, providing an almost no-brainer opportunity if the index moves beyond such a level. In this scenario, continued recovery to an initial 2884 looks very possible with secondary, if bettered, at 2954.
What really surprises (and gives almost dangerous levels of confidence) was that break of the RED uptrend. In our experience, a Break & Recovery like this generally will be a precursor to some strong upward travel. This explains our interest in exceeding the 2820 level as it allegedly makes a longer term target at 2954 extremely possible.
Obviously, we’ve a problem – it’s all a bit obvious and the market never, ever, gives away free gifts like this. There’s even the absurdity of our longer term target visually matching (okay, bettering slightly) the all time highs of October last year. It’s a perfect trading opportunity and thus, it scares us silly. If triggered, the tightest stop is visually 2720 points.
What happens if 2720 breaks?
Initially, reversal to 2646 will make sense. If broken, our secondary is at 2597 but realistically, by reversing below a prior uptrend, adverse market conditions could drive it to 2449 in a blink.
For now, it appears worth keeping an eye on for a move above 2820. Given the index is presently 2791, it’s certainly teasing the prospect.
|
Time Issued |
Market |
Price At Issue |
Short Entry |
Fast Exit |
Slow Exit |
Stop |
Long Entry |
Fast Exit |
Slow Exit |
Stop |
Prior |
|
9:57:13PM |
BRENT |
66.78 |
‘cess |
||||||||
|
9:59:14PM |
GOLD |
1302.17 |
‘cess |
||||||||
|
10:02:21PM |
FTSE |
7161.83 |
Shambles |
||||||||
|
10:14:54PM |
FRANCE |
5264 |
5237 |
5218 |
5192 |
5274 |
5282 |
5298 |
5309 |
5252 |
‘cess |
|
10:17:16PM |
GERMANY |
11507.51 |
‘cess |
||||||||
|
10:20:02PM |
US500 |
2792.17 |
|||||||||
|
10:30:17PM |
DOW |
25562.2 |
|||||||||
|
10:32:35PM |
NASDAQ |
7205.87 |
7158 |
7132 |
7102 |
7200 |
7221 |
7255.25 |
7301 |
7158 |
‘cess |
12/03/2019 FTSE Closed at 7151 points. Change of 0.29%. Total value traded through LSE was: £ 5,866,539,237 a change of 24.22%
11/03/2019 FTSE Closed at 7130 points. Change of 0.37%. Total value traded through LSE was: £ 4,722,810,158 a change of -37.12%
One Reply to “Trends and Targets for 13/03/2019”