Versarien #CAC40 #Nasdaq Our last review of this company (link here) highlighted a share which was expected to drop. It hasn’t, really! But neither has the price managed to go up, instead it’s been splashing around, pretending to be interesting – until now.
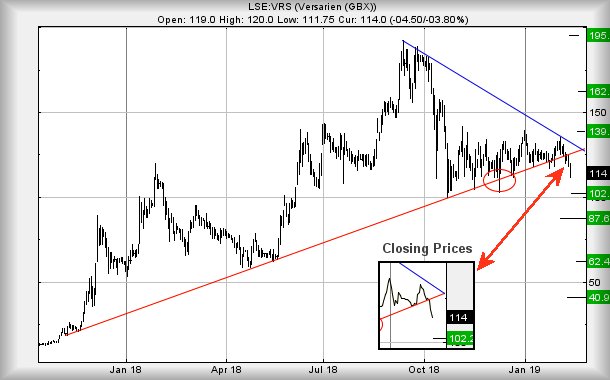
We’ve been keeping a weather eye on the price, mildly puzzled why it remained resilient, and finally noticed something which shall perhaps prove important. Essentially, the RED uptrend should be mapped by closing prices, rather than intraday lows (see chart inset). This is fairly unusual and to us, it generally implies a fairly tight control being exerted against price movements. Unfortunately, this ‘closing price’ phenomena now places the share in considerable trouble, if we take a Big Picture perspective.
The implication now is of weakness below 111p being capable of leading the price down to an initial 102p. At this level, we’d tend anticipate some sort of bounce, probably short lived, as the price has experienced some sort of historical illusory glass floor around the 100p mark. This time, we suspect the glass floor shall break as weakness below 102p indicates the potential of 87p hopefully providing a reasonable point for a bounce.
Alas, there’s a greater potential for misery lurking on the chart and it’s something we’re loathe to ridicule.
In the event of the share trading below the 102p level, it completes a “final” argument which will claim the price has enacted a “Head & Shoulders” trading pattern, meaning there’s an expectation of 62p providing a bottom eventually. Despite this being a visually pleasing argument, we rather suspect any drop – if driven by negative news – could easily accelerate down to a real bottom of 40p.
Now we’ve filled the page with doom laden prophecy, what does the price need to ridicule such scare mongering?
The immediate situation requires any bounce to exceed 130p, moving the price into a zone where an initial target calculates at 139p and relative safety, greatly reducing any expectation of a drop below 102p. Our secondary, should 139p be exceeded, comes in at 162p and, we suspect, a future glass ceiling level.
For now, we’ve no choice but to view this as dangerous.
|
Time Issued |
Market |
Price At Issue |
Short Entry |
Fast Exit |
Slow Exit |
Stop |
Long Entry |
Fast Exit |
Slow Exit |
Stop |
Prior |
|
10:22:24PM |
BRENT |
62.58 |
Success |
||||||||
|
10:23:43PM |
GOLD |
1311.15 |
|||||||||
|
10:25:29PM |
FTSE |
7150.71 |
‘cess |
||||||||
|
10:26:54PM |
FRANCE |
5057.7 |
5044 |
5036.5 |
5024 |
5064 |
5074 |
5084.25 |
5104 |
5037 |
Success |
|
10:29:00PM |
GERMANY |
11154 |
Success |
||||||||
|
10:30:38PM |
US500 |
2745.82 |
Success |
||||||||
|
10:32:25PM |
DOW |
25433.5 |
‘cess |
||||||||
|
10:34:32PM |
NASDAQ |
7013.5 |
6941 |
6912 |
6875 |
6980 |
7020 |
7027 |
7091 |
6944 |
Success |
|
10:36:32PM |
JAPAN |
20945 |
Success |
12/02/2019 FTSE Closed at 7133 points. Change of 0.06%. Total value traded through LSE was: £ 6,357,208,389 a change of 24.24%
11/02/2019 FTSE Closed at 7129 points. Change of 0.82%. Total value traded through LSE was: £ 5,117,035,244 a change of -2.43%