GOLD Updated #Brent #DAX Todays article is being written from a suspiciously tidy desk. Introducing a fancy new “multiple display screen stand” forced a paper tray to be moved, a tray which included a yellowing & faded article we’d written in 2014 about #Gold. To our surprise, it remains relevant! And yes, there was a degree of shaming regarding a desk which had not been cleared for at least 5 years…
Back in 2014, we speculated on what could happen if GOLD bettered 1393 dollars. The answer appears to be “nothing” as it has failed achieve such a surprise movement, instead opting to oscillate within a 300 dollar trading range. There is something happening at present which certainly justifies slight interest.
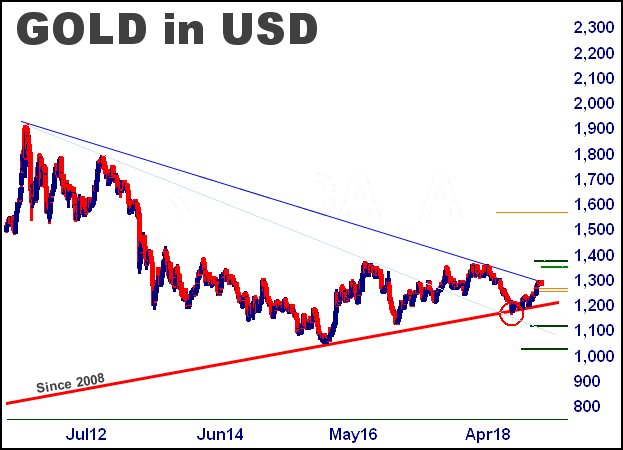
Since August 2011, the metal has produced a pretty obvious downtrend, one which has proven impermeable recently with multiple bonks against the BLUE line on the chart, none of which bettered it. More often, this sort of nonsense creates a self completing prophecy with the market suddenly deciding a line to be unbreakable, suddenly introducing reversals due to a plethora of short positions. In the last couple of days, Gold, with 8 sessions this year finding the Blue line impossible to cross, fell with some predictability.
We’ve two trigger levels for what we expect to come next. The first one, a fairly obvious visual, demands movement below 1280 to provoke further weakness down to 1268 next. If broken, our secondary is currently around 1259. Our second, preferred, trigger is at 1275 due to travel below such a point making a drop to the low 1260’s almost mandatory.
It’s probably worth mentioning the Big Picture chart below.
As shown, reversal to the 1260’s isn’t really a big deal. We are interested in the close attention the price of the metal paid to the downtrend since 2011 as it strongly promotes an argument where movement now above 1300 is very liable to bring some sharp increases in the price of the metal. Alas, we’ve a slightly converse argument, thanks to the break below the long term uptrend circled in RED on the chart. We get a bit paranoid with this sort of thing, thanks to such a break “proving” an uptrend can break. It creates a situation where any movement now below 1200 is very liable to justify sustainable short positions, thanks to any breach being capable of producing some strong falls.
For now, we rather suspect GOLD is indulging in some fakery (though perhaps we’re being subtly influenced by Brexit headlines) and some rebound can be anticipated around the 1260’s, one which should prove capable of bettering BLUE on the chart and attempting a stab at the glass ceiling in the high 1300’s which has existed since 2014.
|
Time Issued |
Market |
Price At Issue |
Short Entry |
Fast Exit |
Slow Exit |
Stop |
Long Entry |
Fast Exit |
Slow Exit |
Stop |
Prior |
|
10:10:00PM |
BRENT |
62.54 |
61.05 |
60.45 |
59.62 |
63 |
62.93 |
63.9875 |
65.96 |
61.3 |
Success |
|
10:12:39PM |
GOLD |
1281.98 |
Success |
||||||||
|
2:42:51AM |
FTSE |
7015.75 |
Success |
||||||||
|
2:57:19AM |
FRANCE |
4875 |
Success |
||||||||
|
3:00:16AM |
GERMANY |
11289 |
10998 |
10882 |
10748 |
11170 |
11289 |
11370.25 |
11422 |
11010 |
‘cess |
|
4:23:42PM |
US500 |
2677.42 |
Success |
||||||||
|
4:26:38PM |
DOW |
24761.2 |
‘cess |
||||||||
|
4:29:08PM |
NASDAQ |
6798.12 |
Success |
||||||||
|
4:34:05PM |
JAPAN |
20958 |
Success |