
#FTSE #GOLD Our “higher highs” rule can sometimes seem a little confusing. The FTSE is currently being celebrated across the financial media after setting a new intraday all-time high of 10,979.80 points. It sounds impressive, eclipsing February’s previous intraday peak of 10,934 points. Should we be overflowing with optimism?
Actually no, we’re not willing to abandon caution.
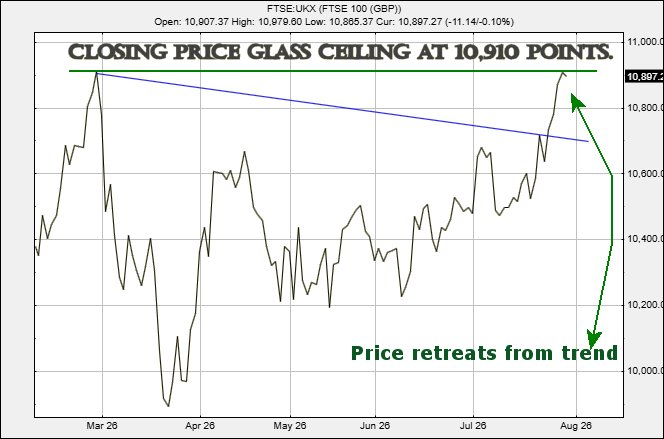
This is due to our favourite rule of thumb, the closing price matters far more than the intraday high. Thus, on February 27th, the FTSE closed the session at 10,910 points. And on Wednesday this week, it closed at 10,908 points, with Thursday 30th July closing the day at 10,897 points. This creates a seriously confusing scenario, where the day when an All Time High made itself known, it was also the same day where the FTSE recorded another “lower low” in its history of closing prices. This is – from our perspective – the Gold Standard of chart signals. The FTSE desperately needed to close above 10,910 points from February, yet the highest closing price achieved in July has been 10,908 points.
We regard this as quite a big deal, an important box remaining unchecked and leaving us poised to take a negative stance on what’s coming next for the UK market. The good news is we appear to be witnessing the formation of a Glass Ceiling – or Flat Trend as we call it – one of these things where future closure above the ceiling (10,910 points) shall almost certainly bring strong upward index movements. Until such an event, our inclination is to regard the All Time High as a fake feint by the market, perhaps designed to make traders abandon short positions in despair!
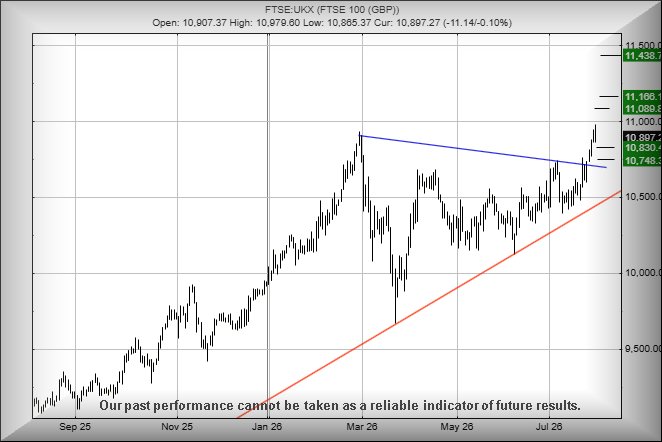
From a near term perspective, we shall be fascinated if the FTSE manages below 10,865 points as this risks triggering reversals to an initial 10,830 points with our secondary, if broken, at a less comfortable 10,748 points. If triggered, the tightest stop loss level works out at 10,915 points. While this secondary target of 10,748 would ideally be one of these strange “backtests”, when the index chooses to challenge the point at which the breakout above Blue occurred. Should this be the case, it will indeed be reasonable to anticipate a bounce from the 10,748 level. A major issue does exist at such a point, due to movement below 10,748 risking a drop of a further 180 points, taking the FTSE below Blue and utterly fouling optimism for the future.
The above negative scenario also gives “the market” the opportunity to park the FTSE for August, giving a “safe” trading range below 10,750 and the 11,000 point level. This would make sense, creating a nursery while the grown ups all head to Butlins for a month.
The Bullish Alternative
Naturally, there’s a positive scenario as well.
A move above 10,980 points should trigger an initial target around 11,089 points. If that level is overcome, our secondary objective becomes 11,166 points. Beyond that, we’d expect the longer-term influence of 11,438 to begin asserting itself.
Have a good weekend.
We’re now in that unfortunate part of the year when Formula 1 disappears for its summer break. Around here in Argyll, the main spectator sport becomes avoiding tourists negotiating the single-track roads. On the bright side, the foreign number plates are noticeably fewer this year, with only the occasional Irish registration making an appearance. Whether that’s good news probably depends on how much time you’ve spent behind a hesitant caravan on a Highland passing place.
FUTURES
FUTURES
| Time Issued | Market | Price At Issue | Short Entry | Fast Exit | Slow Exit | Stop | Long Entry | Fast Exit | Slow Exit | Stop | Prior |
| 11:37:08PM | BRENT | ||||||||||
| 10:55:21PM | GOLD | 4092.82 | 4028 | 3993 | 3953 | 4052 | 4120 | 4133 | 4148 | 4098 | |
| 10:59:30PM | FTSE | 10917.1 | 10791 | 10710 | 10620 | 10850 | 10980 | 11011 | 11043 | 10913 | ‘cess |
| 11:03:04PM | STOX50 | ||||||||||
| 11:05:19PM | GERMANY | ||||||||||
| 11:07:06PM | US500 | ||||||||||
| 11:09:28PM | DOW | ||||||||||
| 11:12:38PM | NASDAQ | ||||||||||
| 11:15:18PM | JAPAN |

SUCCESS above means both FAST & SLOW targets were met. ‘CESS means just the FAST target met and probably the next time it is exceeded, movement to the SLOW target shall commence.
Our commentary is in two sections. Immediately below are today’s updated comments. If our commentary remains valid, the share can be found in the bottom section which has a RED heading. Hopefully, this will mean you no longer need to flip back through previous reports. HYPERLINKS DISABLED IN THIS VERSION
Please remember, all prices are mid-price (halfway between the Buy and Sell). When we refer to a price CLOSING above a specific level, we are viewing the point where we can regard a trend as changing. Otherwise, we are simply speculating on near term trading targets. Our website is www.trendsandtargets.com.
UPDATE. We often give an initial and a secondary price. If the initial is exceeded, we still expect it to fall back but the next time the initial is bettered, the price should continue to the secondary. The converse it true with price drops.
We can be contacted at info@trendsandtargets.com. Spam filters set to maximum so only legit emails get through…
Section One – Outlook Updated Today. Click here for Section Two – Outlook Remains Valid shares
Click Epic to jump to share: LSE:CNA Centrica** **LSE:GRG Greggs** **LSE:HSBA HSBC** **LSE:ITRK Intertek** **LSE:LLOY Lloyds Grp.** **LSE:MKS Marks and Spencer** **LSE:NWG Natwest** **LSE:STAN Standard Chartered** **
********
Updated charts published on : Centrica, Greggs, HSBC, Intertek, Lloyds Grp., Marks and Spencer, Natwest, Standard Chartered,
LSE:CNA Centrica. Close Mid-Price: 152.6 Percentage Change: + 0.00% Day High: 156.95 Day Low: 152.55
Target met. If Centrica intends to relax, the price needs to get below 15 ……..
</p
View Previous Centrica & Big Picture ***
LSE:GRG Greggs. Close Mid-Price: 2032 Percentage Change: + 0.00% Day High: 2046 Day Low: 1961
Further movement against Greggs ABOVE 2046 should improve acceleration to ……..
</p
View Previous Greggs & Big Picture ***
LSE:HSBA HSBC. Close Mid-Price: 1587 Percentage Change: + 0.00% Day High: 1595.6 Day Low: 1548
Target met. If the price of HSBC manages to move ABOVE 1595.6, initial UP ……..
</p
View Previous HSBC & Big Picture ***
LSE:ITRK Intertek. Close Mid-Price: 5835 Percentage Change: + 0.00% Day High: 5850 Day Low: 5830
Continued trades against ITRK with a mid-price ABOVE 5850 should improve ……..
</p
View Previous Intertek & Big Picture ***
LSE:LLOY Lloyds Grp.. Close Mid-Price: 115.65 Percentage Change: + 0.00% Day High: 116.15 Day Low: 107.65
Continued trades against LLOY with a mid-price ABOVE 116.15 should improv ……..
</p
View Previous Lloyds Grp. & Big Picture ***
LSE:MKS Marks and Spencer. Close Mid-Price: 409.5 Percentage Change: + 0.00% Day High: 411 Day Low: 401.1
The next task for Marks and Spencer is to get the price above 411 (not wi ……..
</p
View Previous Marks and Spencer & Big Picture ***
LSE:NWG Natwest. Close Mid-Price: 683.8 Percentage Change: + 0.00% Day High: 691.6 Day Low: 656.8
If the price of Natwest manages to move ABOVE 691.6, initial UP target be ……..
</p
View Previous Natwest & Big Picture ***
LSE:STAN Standard Chartered. Close Mid-Price: 2216 Percentage Change: + 0.00% Day High: 2239 Day Low: 2139
Target met. In the event of STAN share price managing to exceed 2239 (ple ……..
</p
View Previous Standard Chartered & Big Picture ***