FTSE for FRIDAY & “Gotcha” explained  

#FTSE #GOLD

Increasingly, we’re seeing market behaviour which is tending to prove a ‘safe’ indicator of future behaviour.  Obviously, like any visual indicator, the “Gotcha” cannot be regarded as 100% reliable but currently, both the FTSE and Bitcoin appear to be prepping themselves to once again trap traders.

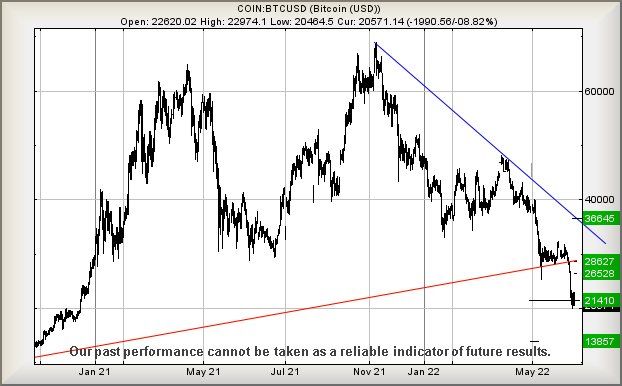
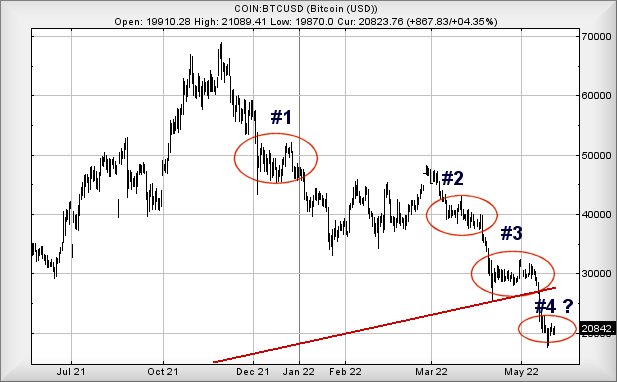
The Bitcoin chart below is fairly simple.

Back in December last year, #1 delineates a period where “everyone” finally concluded Bitcoin wasn’t going to fall far below $50,000. Suddenly, “Gotcha”.

In March this year, #2 shows a period where the market conspired to give a solid impression $40,000 was a solid floor. Once again, “Gotcha”.

Then came April/May, period #3 with an even longer period absolutely convincing everyone Bitcoin had finally bottomed at $30,000. Oops and another “Gotcha”.

Finally, it feels like Bitcoin is starting period #4, a visually assuring picture of Bitcoin finally stopping falling at $20,000 and just 29% of its high in 2021. Obviously, there’s no way Bitcoin is going to fall further… is there?

This market behaviour, a price essentially flatlining for a while, increasingly feels contrived and designed to create a situation where a large number of traders convince themselves a trade is “safe”. Often, during the relative flat period, there will be contradictory movements and in a falling market, these comprise short lived nudges upwards. When this sort of nonsense occurs, we generally insist on hard proof market direction has changed. In the case of Bitcoin, this is a demand the value exceed $28,000, the level of the most recent Red trend break.

Importantly, the converse also proves remarkably reliable. When a price starts to flatline in a rising market, it often feels this is designed to get folk to off-load positions as they convince themselves a price is going to higher. Virtually every trader has a tale to tell of selling (in profit), only to miss the real substantial rise.

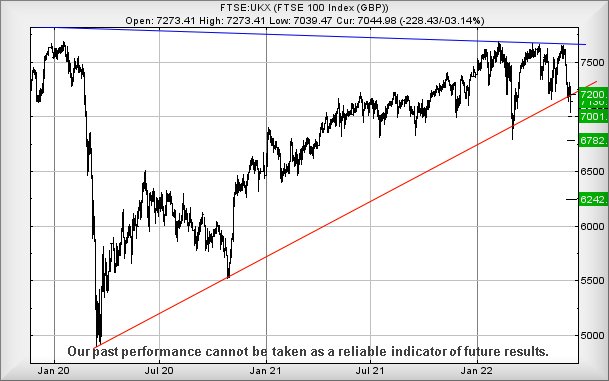
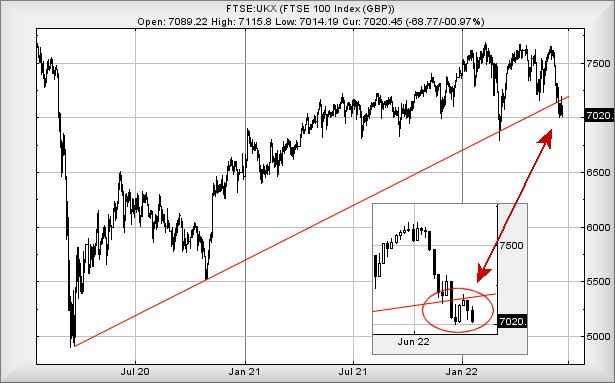
For The FTSE, the most recent 5 trading sessions appear contrived to convince the market the FTSE has a floor of 7000 points. The index broke through the uptrend since 2020, fell to 7000 and stopped falling. We should obviously all rush out and take Long positions with a Stop just below 7000 as the FTSE has obviously discovered a floor level. We’ve a little problem with this behaviour as it’s vanishingly rare for an item to break such an uptrend, then completely stop falling.

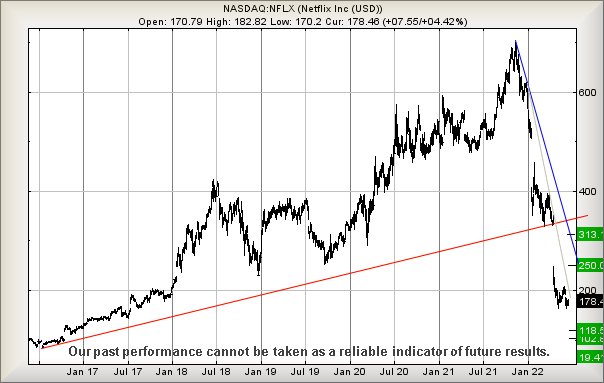
Instead, we suspect the market is preparing a “Gotcha” scenario, the FTSE needing above 7160 points to give us a reasonable first indication a further drop should not be anticipated. Curiously, when we examine other markets, Wall St remains in a “Gotcha” position whereas the Nasdaq has now given the first suggestion a severe reversal should not be anticipated. Hopefully the next few session should provide clarity while the world decides what it wants to do. Perhaps the Nasdaq is an early indicator the wildly mooted stock market recession is perhaps not currently scheduled.

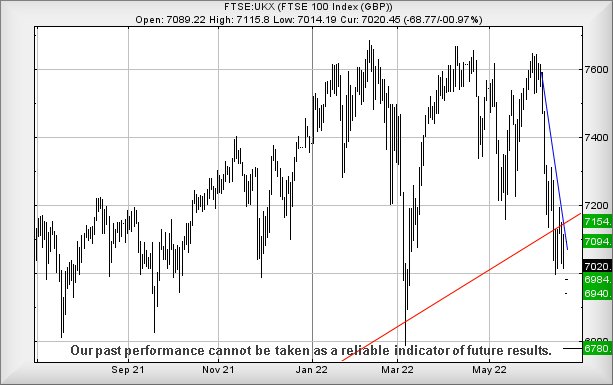
As for the FTSE near term (trading around 7022 at time of writing), below 7014 looks problematic as reversal to an initial 6984 calculates as possible. Our secondary, should such a level break, works out at 6940 points, along with a probable bounce.

For an alternate scenario above 7075 looks mildly interesting, allowing an initial 7094 points with secondary, if exceeded, a rather more useful 7154 points, almost the level above which our Big Picture drop scenario becomes invalid.


FUTURES

Time Issued Market Price At Issue Short Entry Fast Exit Slow Exit Stop Long Entry Fast Exit Slow Exit Stop Prior
10:32:24PM BRENT 106.78 105.8 104.735 108.7 110 111.26 107.75
10:34:02PM GOLD 1822.9 1822 1813 1831 1846 1850 1834 Success
10:35:51PM FTSE 7015 6990 6959 7057 7122 7172 7055
10:37:57PM FRANCE 5911.3 5827 5821 5871 5912 5933 5892 ‘cess
10:40:29PM GERMANY 12928 12898 12850 12980 13014 13059 12910 ‘cess
10:42:03PM US500 3782.42 3730 3711 3771 3801 3832 3758
10:44:13PM DOW 30590.9 30252 30065 30398 30714 30912 30536
10:46:14PM NASDAQ 11668.47 11450 11401 11590 11731 11828 11510
10:48:23PM JAPAN 26186 25972 25830 26129 26298 26337 26178


23/06/2022 FTSE Closed at 7020 points. Change of -0.97%. Total value traded through LSE was: £ 5,680,077,638 a change of -12.72%
22/06/2022 FTSE Closed at 7089 points. Change of -0.88%. Total value traded through LSE was: £ 6,507,643,698 a change of 40.38%
21/06/2022 FTSE Closed at 7152 points. Change of 0.44%. Total value traded through LSE was: £ 4,635,756,984 a change of -23.37%
20/06/2022 FTSE Closed at 7121 points. Change of 1.5%. Total value traded through LSE was: £ 6,049,529,686 a change of -50.99%
17/06/2022 FTSE Closed at 7016 points. Change of -0.4%. Total value traded through LSE was: £ 12,344,389,846 a change of 36.38%
16/06/2022 FTSE Closed at 7044 points. Change of -3.15%. Total value traded through LSE was: £ 9,051,276,874 a change of 32.71%
15/06/2022 FTSE Closed at 7273 points. Change of 1.2%. Total value traded through LSE was: £ 6,820,318,073 a change of -14.4%

SUCCESS above means both FAST & SLOW targets were met. ‘CESS means just the FAST target met and probably the next time it is exceeded, movement to the SLOW target shall commence.

Our commentary is in two sections. Immediately below are today’s updated comments. If our commentary remains valid, the share can be found in the bottom section which has a RED heading. Hopefully, this will mean you no longer need to flip back through previous reports. HYPERLINKS DISABLED IN THIS VERSION

Please remember, all prices are mid-price (halfway between the Buy and Sell). When we refer to a price CLOSING above a specific level, we are viewing the point where we can regard a trend as changing. Otherwise, we are simply speculating on near term trading targets. Our website is www.trendsandtargets.com.

UPDATE. We often give an initial and a secondary price. If the initial is exceeded, we still expect it to fall back but the next time the initial is bettered, the price should continue to the secondary. The converse it true with price drops.

We can be contacted at info@trendsandtargets.com. Spam filters set to maximum so only legit emails get through…

Section One – Outlook Updated Today. Click here for Section Two – Outlook Remains Valid shares

Click Epic to jump to share: LSE:AVCT Avacta** **LSE:CBX Cellular Goods** **LSE:ITM ITM Power** **LSE:TRN The Trainline** **

********

Updated charts published on : Avacta, Cellular Goods, ITM Power, The Trainline,

LSE:AVCT Avacta Close Mid-Price: 97 Percentage Change: -11.01% Day High: 111 Day Low: 91

If Avacta experiences continued weakness below 91, it will invariably lea ……..

Subscribe for more

</p

View Previous Avacta & Big Picture ***

LSE:CBX Cellular Goods Close Mid-Price: 1.32 Percentage Change: -1.85% Day High: 1.35 Day Low: 1.31

Continued weakness against CBX taking the price below 1.31 calculates as ……..

Subscribe for more

</p

View Previous Cellular Goods & Big Picture ***

LSE:ITM ITM Power Close Mid-Price: 190.4 Percentage Change: -8.15% Day High: 207 Day Low: 189.65

Weakness on ITM Power below 189.65 will invariably lead to 182 with secon ……..

Subscribe for more

</p

View Previous ITM Power & Big Picture ***

LSE:TRN The Trainline Close Mid-Price: 284.6 Percentage Change: -10.14% Day High: 311.8 Day Low: 278.5

This is properly confusing, doubtless enjoying the effect of the current i ……..

Subscribe for more

</p

View Previous The Trainline & Big Picture ***

*** End of “Updated Today” comments on shares.

Netflix, not worth watching…

#Brent #WallSt

Once upon a time, we were all trapped in a world where we couldn’t go out, we couldn’t travel, forced to ‘enjoy’ the company of immediate family. But we were thankfully permitted to more our place of work to a kitchen table, a hurriedly built shelf in a bedroom, or wherever. During this period, shares prices of companies catering for the change in society soared, while airline shares fell, hospitality shares fell, travel shares drove endlessly downward.


Now, with society returning to whatever passes as normal, it’s not unexpected to see online shopping companies getting a bit of a hammering, the shine coming off electronics companies, even Peloton share price running itself into the ground, and streaming companies such as Netflix discovering their growth in customer numbers was to prove a short lived phenomena. Quite why the company think an effective business model for the future is to alienate their remaining client base by increasing prices while reducing accessibility.

Meanwhile, hospitality shares should be soaring, cinema shares climbing remorselessly, airline shares flying over the moon, and cruise line shares riding the crest of a cliché. Alas, the stock market often isn’t a place where it gives with one hand while taking with the other. Instead, one hand will often have investors by the throat while the other is searching for the spot to stick a knife!


Netflix share price has achieved a greater level of pain than we’d expected, the value now trading substantially below the Covid-19 low of 2020 (290p), the point from which it soared to 700p. At time of writing, the share price is trading around 178 and we suspect this situation is destined to become worse.

Presently, below 162 looks capable of provoking reversal to an initial 118 with secondary, if broken, calculating at 102 and hopefully a bottom capable of producing a real bounce. We’ve a pretty good reason to hope 102 shall prove to enjoy trampoline qualities, thanks to a quite nasty risk if the 102 level breaks. Doing so would move the price into a region, where we calculate an absurd looking 19 as the “ultimate bottom” for the streaming service. We’re more than a little sceptical over this 19 target level as it would return the share price to a level not seen since 10 years ago.


Thankfully, with their business of making movies, Netflix perhaps shall prove capable of producing a happy ending for the current situation. Presently, the price needs exceed 209 to give hope as this calculates with the potential of an initial 250 with secondary, if exceeded, a rather less confident looking 313.

FUTURES

Time Issued Market Price At Issue Short Entry Fast Exit Slow Exit Stop Long Entry Fast Exit Slow Exit Stop Prior
9:59:41PM BRENT 107.59 104.78 104.275 97.89 110.67 110.35 111.335 113.49 107.43 Success
10:01:34PM GOLD 1837 Shambles
10:03:39PM FTSE 7071 Success
10:05:58PM FRANCE 5890 Success
10:32:37PM GERMANY 13113 Success
10:35:50PM US500 3757 Shambles
10:38:12PM DOW 30486 29988 29700 29339 30240 30781 30985 31310 30505
10:40:02PM NASDAQ 11513 ‘cess
10:42:25PM JAPAN 26210


22/06/2022 FTSE Closed at 7089 points. Change of -0.88%. Total value traded through LSE was: £ 6,507,643,698 a change of 40.38%
21/06/2022 FTSE Closed at 7152 points. Change of 0.44%. Total value traded through LSE was: £ 4,635,756,984 a change of -23.37%
20/06/2022 FTSE Closed at 7121 points. Change of 1.5%. Total value traded through LSE was: £ 6,049,529,686 a change of -50.99%
17/06/2022 FTSE Closed at 7016 points. Change of -0.4%. Total value traded through LSE was: £ 12,344,389,846 a change of 36.38%
16/06/2022 FTSE Closed at 7044 points. Change of -3.15%. Total value traded through LSE was: £ 9,051,276,874 a change of 32.71%
15/06/2022 FTSE Closed at 7273 points. Change of 1.2%. Total value traded through LSE was: £ 6,820,318,073 a change of -14.4%
14/06/2022 FTSE Closed at 7187 points. Change of -0.25%. Total value traded through LSE was: £ 7,967,426,420 a change of 8.5%

SUCCESS above means both FAST & SLOW targets were met. ‘CESS means just the FAST target met and probably the next time it is exceeded, movement to the SLOW target shall commence.

Our commentary is in two sections. Immediately below are today’s updated comments. If our commentary remains valid, the share can be found in the bottom section which has a RED heading. Hopefully, this will mean you no longer need to flip back through previous reports. HYPERLINKS DISABLED IN THIS VERSION

Please remember, all prices are mid-price (halfway between the Buy and Sell). When we refer to a price CLOSING above a specific level, we are viewing the point where we can regard a trend as changing. Otherwise, we are simply speculating on near term trading targets. Our website is www.trendsandtargets.com.

UPDATE. We often give an initial and a secondary price. If the initial is exceeded, we still expect it to fall back but the next time the initial is bettered, the price should continue to the secondary. The converse it true with price drops.

We can be contacted at info@trendsandtargets.com. Spam filters set to maximum so only legit emails get through…

Section One – Outlook Updated Today. Click here for Section Two – Outlook Remains Valid shares

Click Epic to jump to share: LSE:CNA Centrica** **LSE:DDDD 4D Pharma** **LSE:EXPN Experian** **LSE:EZJ EasyJet** **LSE:FOXT Foxtons** **LSE:HIK Hikma** **LSE:HUR Hurrican Energy** **LSE:IHG Intercontinental Hotels Group** **LSE:ITM ITM Power** **LSE:RMG Royal Mail** **LSE:SDY Speedyhire** **LSE:SPX Spirax** **LSE:TW. Taylor Wimpey** **

********

Updated charts published on : Centrica, 4D Pharma, Experian, EasyJet, Foxtons, Hikma, Hurrican Energy, Intercontinental Hotels Group, ITM Power, Speedyhire, Spirax, Taylor Wimpey,

LSE:CNA Centrica. Close Mid-Price: 83.54 Percentage Change: + 4.58% Day High: 83.58 Day Low: 78.28

Further movement against Centrica ABOVE 83.58 should improve acceleration ……..

Subscribe for more

</p

View Previous Centrica & Big Picture ***

LSE:DDDD 4D Pharma Close Mid-Price: 15.2 Percentage Change: -7.88% Day High: 17 Day Low: 13.6

Weakness on 4D Pharma below 13.6 will invariably lead to 13 with secondar ……..

Subscribe for more

</p

View Previous 4D Pharma & Big Picture ***

LSE:EXPN Experian. Close Mid-Price: 2318 Percentage Change: + 1.44% Day High: 2324 Day Low: 2242

In the event Experian experiences weakness below 2242 it calculates with ……..

Subscribe for more

</p

View Previous Experian & Big Picture ***

LSE:EZJ EasyJet Close Mid-Price: 412.3 Percentage Change: -0.82% Day High: 424.4 Day Low: 401.8

If EasyJet experiences continued weakness below 401.8, it will invariably ……..

Subscribe for more

</p

View Previous EasyJet & Big Picture ***

LSE:FOXT Foxtons. Close Mid-Price: 34 Percentage Change: + 0.15% Day High: 34 Day Low: 31.6

Target met. Weakness on Foxtons below 31.6 will invariably lead to 29p wi ……..

Subscribe for more

</p

View Previous Foxtons & Big Picture ***

LSE:HIK Hikma. Close Mid-Price: 1502.5 Percentage Change: + 1.38% Day High: 1508.5 Day Low: 1459.5

Continued weakness against HIK taking the price below 1459.5 calculates a ……..

Subscribe for more

</p

View Previous Hikma & Big Picture ***

LSE:HUR Hurrican Energy Close Mid-Price: 6.8 Percentage Change: -9.33% Day High: 8 Day Low: 6.77

Continued trades against HUR with a mid-price ABOVE 8 should improve the ……..

Subscribe for more

</p

View Previous Hurrican Energy & Big Picture ***

LSE:IHG Intercontinental Hotels Group Close Mid-Price: 4239 Percentage Change: -1.60% Day High: 4301 Day Low: 4174

Continued weakness against IHG taking the price below 4174 calculates as ……..

Subscribe for more

</p

View Previous Intercontinental Hotels Group & Big Picture ***

LSE:ITM ITM Power Close Mid-Price: 207.3 Percentage Change: -4.34% Day High: 211.4 Day Low: 201.1

If ITM Power experiences continued weakness below 201.1, it will invariab ……..

Subscribe for more

</p

View Previous ITM Power & Big Picture ***

LSE:RMG Royal Mail. Close Mid-Price: 273.5 Percentage Change: + 0.04% Day High: 275.2 Day Low: 258.8

In the event Royal Mail experiences weakness below 258.8 it calculates wi ……..

Subscribe for more

</p

View Previous Royal Mail & Big Picture ***

LSE:SDY Speedyhire Close Mid-Price: 44.95 Percentage Change: -0.22% Day High: 45.35 Day Low: 43.65

Target met. In the event Speedyhire experiences weakness below 43.65 it c ……..

Subscribe for more

</p

View Previous Speedyhire & Big Picture ***

LSE:SPX Spirax. Close Mid-Price: 9346 Percentage Change: + 1.59% Day High: 9456 Day Low: 9008

If Spirax experiences continued weakness below 9008, it will invariably l ……..

Subscribe for more

</p

View Previous Spirax & Big Picture ***

LSE:TW. Taylor Wimpey Close Mid-Price: 116.5 Percentage Change: -0.68% Day High: 117.5 Day Low: 114.75

If Taylor Wimpey experiences continued weakness below 114.75, it will inv ……..

Subscribe for more

</p

View Previous Taylor Wimpey & Big Picture ***

*** End of “Updated Today” comments on shares.

Nostrum Oil & Gas, a Star Trek connection!

#FTSE #France

It’s not often a share trading code sparks a search but Nostrum managed it. Their moniker, NOG, rung a very faint bell and an immediate assumption Nog was a character from Lord of the Rings. This turned out to be a big nope. Nog was a character in a Star Trek spin-off. It’s amazing how trivia from nearly 30 years ago remains in a little pigeon hole of memory, making it questionable just why the human brain decides something is worth retaining!

We received a couple of emails asking our opinion on Nostrum and despite an initial temptation to reply “big ears, dodgy forehead”, it was deemed proper to do a little more research beyond satisfying ourselves who “Nog” was. Nostrum Oil & Gas, headquartered in London, listed on the FTSE, are a Kazakhstan producer and judging by their history, on the go since 2004 and listed since 2013. Their listing recently moved from ‘Premium Listing’ to ‘Standard Listing’ and if we’re honest, we’ve no idea what this shall mean for the share price.

However, it certainly appears something may be happening.

The chart below has a circled area, delineating something odd which occurred toward the end of May. The share price did a little dance for a few days, it transpiring the price exceeding 6.576p at that particular time was significant. The light blue trend describes something we usually ignore, a really big picture downtrend from a time in 2014 where Nostrum had a share price of 825p. This sort long distance trend line from an impossible high is generally an obstacle a share price treats as invisible but on this occasion, there were a series of price movements which tend indicate the market was perfectly aware of what just happened.

Okay, maybe this sort of thing is fascinating to just us, but when the market reacts to an event, it’s always worth pausing for thought and wondering why.

Secondly, the last couple of sessions have witnessed the share price break through the Blue downtrend since 2019, yet fail to close above the trend. Our chart inset highlights the share price is carefully mirroring the Blue trend line. We’ve a theory, should the share price now exceed these breakout levels, some positive action can be anticipated.

If our suspicion above proves correct, it’s probably safe to view the Bigger Picture chart below. Currently, above 8.85p can allegedly suggest movement to an initial 12p with secondary, if exceeded, a rather more impressive 15.4p. Obviously, if playing safe, closure above Blue (presently 8.5p) will make a lot of sense but in this instance, if our guess about the wider market paying attention is correct, any movement is liable to prove rather quick.

Visually, there’s a fairly strong hint the 15p level should provide some sort of glass ceiling for future rises but we can risk suggesting, closure above 15p is liable to prove quite game changing as a third target level at 26p makes itself very possible.

FUTURES

Time Issued Market Price At Issue Short Entry Fast Exit Slow Exit Stop Long Entry Fast Exit Slow Exit Stop Prior
9:27:55PM BRENT 112.81 ‘cess
9:29:22PM GOLD 1833.7 ‘cess
9:32:01PM FTSE 7152.56 7116 7099 7067 7162 7195 7218 7303 7151 ‘cess
9:34:00PM FRANCE 5943.3 5924 5893 5847 5966 6031 6054 6110 5990 Success
9:36:28PM GERMANY 13267 Success
10:07:22PM US500 3767 Success
10:09:11PM DOW 30548 Success
10:10:41PM NASDAQ 11549 Success
10:12:43PM JAPAN 26520 Success
21/06/2022 FTSE Closed at 7152 points. Change of 0.44%. Total value traded through LSE was: £ 4,635,756,984 a change of -23.37%
20/06/2022 FTSE Closed at 7121 points. Change of 1.5%. Total value traded through LSE was: £ 6,049,529,686 a change of -50.99%
17/06/2022 FTSE Closed at 7016 points. Change of -0.4%. Total value traded through LSE was: £ 12,344,389,846 a change of 36.38%
16/06/2022 FTSE Closed at 7044 points. Change of -3.15%. Total value traded through LSE was: £ 9,051,276,874 a change of 32.71%
15/06/2022 FTSE Closed at 7273 points. Change of 1.2%. Total value traded through LSE was: £ 6,820,318,073 a change of -14.4%
14/06/2022 FTSE Closed at 7187 points. Change of -0.25%. Total value traded through LSE was: £ 7,967,426,420 a change of 8.5%
13/06/2022 FTSE Closed at 7205 points. Change of -1.53%. Total value traded through LSE was: £ 7,343,380,444 a change of 22%

SUCCESS above means both FAST & SLOW targets were met. ‘CESS means just the FAST target met and probably the next time it is exceeded, movement to the SLOW target shall commence.

Our commentary is in two sections. Immediately below are today’s updated comments. If our commentary remains valid, the share can be found in the bottom section which has a RED heading. Hopefully, this will mean you no longer need to flip back through previous reports. HYPERLINKS DISABLED IN THIS VERSION

Please remember, all prices are mid-price (halfway between the Buy and Sell). When we refer to a price CLOSING above a specific level, we are viewing the point where we can regard a trend as changing. Otherwise, we are simply speculating on near term trading targets. Our website is www.trendsandtargets.com.

UPDATE. We often give an initial and a secondary price. If the initial is exceeded, we still expect it to fall back but the next time the initial is bettered, the price should continue to the secondary. The converse it true with price drops.

We can be contacted at info@trendsandtargets.com. Spam filters set to maximum so only legit emails get through…

Section One – Outlook Updated Today. Click here for Section Two – Outlook Remains Valid shares

Click Epic to jump to share: LSE:CASP Caspian** **LSE:DDDD 4D Pharma** **LSE:FOXT Foxtons** **LSE:HUR Hurrican Energy** **LSE:NG. National Glib** **LSE:RBD Reabold Resources PLC** **LSE:RKH Rockhopper** **LSE:RR. Rolls Royce** **

********

Updated charts published on : Caspian, 4D Pharma, Foxtons, Hurrican Energy, National Glib, Reabold Resources PLC, Rockhopper, Rolls Royce,

LSE:CASP Caspian. Close Mid-Price: 5 Percentage Change: + 7.53% Day High: 5.05 Day Low: 4.65

Above 5.3 is liable to prove significant, provoking an initial 5.85 with s ……..

Subscribe for more

</p

View Previous Caspian & Big Picture ***

LSE:DDDD 4D Pharma Close Mid-Price: 16.5 Percentage Change: -32.52% Day High: 26.15 Day Low: 16.7

Target met. In the event 4D Pharma experiences weakness below 16.7 it cal ……..

Subscribe for more

</p

View Previous 4D Pharma & Big Picture ***

LSE:FOXT Foxtons Close Mid-Price: 33.95 Percentage Change: -3.41% Day High: 35.15 Day Low: 33.55

If Foxtons experiences continued weakness below 33.55, it will invariably ……..

Subscribe for more

</p

View Previous Foxtons & Big Picture ***

LSE:HUR Hurrican Energy. Close Mid-Price: 7.5 Percentage Change: + 30.43% Day High: 7.5 Day Low: 6

Above just 7.75 now allows for price recovery to an initial 8.7p with seco ……..

Subscribe for more

</p

View Previous Hurrican Energy & Big Picture ***

LSE:NG. National Glib Close Mid-Price: 1028.5 Percentage Change: -0.92% Day High: 1042 Day Low: 1020

Continued weakness against NG. taking the price below 1020 calculates as ……..

Subscribe for more

</p

View Previous National Glib & Big Picture ***

LSE:RBD Reabold Resources PLC Close Mid-Price: 0.29 Percentage Change: -9.38% Day High: 0.32 Day Low: 0.28

Something is finally happening, though not particularly good. Below 0.28 i ……..

Subscribe for more

</p

View Previous Reabold Resources PLC & Big Picture ***

LSE:RKH Rockhopper Close Mid-Price: 7.2 Percentage Change: -4.00% Day High: 7.22 Day Low: 6.9

In the event Rockhopper experiences weakness below 6.9 it calculates with ……..

Subscribe for more

</p

View Previous Rockhopper & Big Picture ***

LSE:RR. Rolls Royce Close Mid-Price: 90.83 Percentage Change: -0.73% Day High: 92.79 Day Low: 90.89

Further movement against Rolls Royce ABOVE 92.79 should improve accelerat ……..

Subscribe for more

</p

View Previous Rolls Royce & Big Picture ***

*** End of “Updated Today” comments on shares.

ASOS, a discount price?

#Gold #Nasdaq

When a company issues three profit warnings within a single year, there’s generally a reasonable expectation something is going horribly wrong. ASOS have opted to join this exclusive club, their share price retreating from 60 quid down to a current £8.70. The picture is not pretty, unable to be photo-shopped unlike the images on their website.

Various stories have emerged regarding online buyer habits which companies similar to ASOS need deal with. ASOS do not charge for returns, so there’s little impediment to stop buyers ordering £1,000 of clothing, intending to only keep £100 of it. The may order multiple sizes of an identical product, intending to keep the one which fits. It even makes a degree of sense but perhaps isn’t the ideal business model for an online retailer.

Another classic wheeze is something called “wardrobing”, ordering an outfit intended to be worn for a Zoom video call, then returned. Personally, I wish there was a facility where I could order a slimmer, fitter, version of myself for video calls! It’s certainly not looking like a fun time to be in the online clothing industry.


ASOS, with a share price trading at levels not seen since 2010, are looking as attractive as a Government advert for a Covid-19 initiative. Visually, we’re far from the convinced the share price has yet exhibited a viable entry level, instead suspecting it has some more relaxation ahead. The recent market movement which gapped the price below Red on the chart was especially significant, the market sending a clear signal the uptrend since 2010 no longer applies.

Now, it appears below 775p calculates with the potential of reversal to 592p as a fairly major point of interest. We’ve a strong reason to hope for a bounce around such a level as our longer term secondary, if the initial breaks, works out at an ‘Ultimate Bottom’ of just 90p, a level below which we cannot calculate.

If ASOS intends escape the current nightmare situation, the share price requires to recover above Red, presently 1,150p to tick the first box for a return to sanity. To summarise, we’re not inclined to view ASOS share price as “cheap”, quite the opposite.


FUTURES

Time Issued Market Price At Issue Short Entry Fast Exit Slow Exit Stop Long Entry Fast Exit Slow Exit Stop Prior
9:39:13PM BRENT 112.24 ‘cess
9:42:11PM GOLD 1839.12 1833 1829 1824 1842 1846 1851 1867 1836
9:48:48PM FTSE 7114.91
9:50:37PM FRANCE 5916
9:53:56PM GERMANY 13270 ‘cess
9:55:37PM US500 3713
9:57:18PM DOW 30153
9:59:26PM NASDAQ 11390 11238 11197 11128 11363 11407 11457 11599 11288
10:01:49PM JAPAN 25974


20/06/2022 FTSE Closed at 7121 points. Change of 1.5%. Total value traded through LSE was: £ 6,049,529,686 a change of -50.99%
17/06/2022 FTSE Closed at 7016 points. Change of -0.4%. Total value traded through LSE was: £ 12,344,389,846 a change of 36.38%
16/06/2022 FTSE Closed at 7044 points. Change of -3.15%. Total value traded through LSE was: £ 9,051,276,874 a change of 32.71%
15/06/2022 FTSE Closed at 7273 points. Change of 1.2%. Total value traded through LSE was: £ 6,820,318,073 a change of -14.4%
14/06/2022 FTSE Closed at 7187 points. Change of -0.25%. Total value traded through LSE was: £ 7,967,426,420 a change of 8.5%
13/06/2022 FTSE Closed at 7205 points. Change of -1.53%. Total value traded through LSE was: £ 7,343,380,444 a change of 22%
10/06/2022 FTSE Closed at 7317 points. Change of -2.13%. Total value traded through LSE was: £ 6,019,204,674 a change of -10.01%

SUCCESS above means both FAST & SLOW targets were met. ‘CESS means just the FAST target met and probably the next time it is exceeded, movement to the SLOW target shall commence.

Our commentary is in two sections. Immediately below are today’s updated comments. If our commentary remains valid, the share can be found in the bottom section which has a RED heading. Hopefully, this will mean you no longer need to flip back through previous reports. HYPERLINKS DISABLED IN THIS VERSION

Please remember, all prices are mid-price (halfway between the Buy and Sell). When we refer to a price CLOSING above a specific level, we are viewing the point where we can regard a trend as changing. Otherwise, we are simply speculating on near term trading targets. Our website is www.trendsandtargets.com.

UPDATE. We often give an initial and a secondary price. If the initial is exceeded, we still expect it to fall back but the next time the initial is bettered, the price should continue to the secondary. The converse it true with price drops.

We can be contacted at info@trendsandtargets.com. Spam filters set to maximum so only legit emails get through…

Section One – Outlook Updated Today. Click here for Section Two – Outlook Remains Valid shares

Click Epic to jump to share: LSE:BDEV Barrett Devs** **LSE:CBX Cellular Goods** **LSE:DDDD 4D Pharma** **LSE:HUR Hurrican Energy** **LSE:OXIG Oxford Instruments** **LSE:RR. Rolls Royce** **LSE:TW. Taylor Wimpey** **LSE:ZOO Zoo Digital** **

********

Updated charts published on : Barrett Devs, Cellular Goods, 4D Pharma, Hurrican Energy, Oxford Instruments, Rolls Royce, Taylor Wimpey, Zoo Digital,

LSE:BDEV Barrett Devs Close Mid-Price: 454.4 Percentage Change: -3.71% Day High: 476 Day Low: 446.9

Target met. In the event Barrett Devs experiences weakness below 446.9 it ……..

Subscribe for more

</p

View Previous Barrett Devs & Big Picture ***

LSE:CBX Cellular Goods. Close Mid-Price: 1.4 Percentage Change: + 0.00% Day High: 1.4 Day Low: 1.33

If Cellular Goods experiences continued weakness below 1.33, it will inva ……..

Subscribe for more

</p

View Previous Cellular Goods & Big Picture ***

LSE:DDDD 4D Pharma. Close Mid-Price: 24.45 Percentage Change: + 4.94% Day High: 25 Day Low: 22.1

If 4D Pharma experiences continued weakness below 22.1, it will invariabl ……..

Subscribe for more

</p

View Previous 4D Pharma & Big Picture ***

LSE:HUR Hurrican Energy Close Mid-Price: 5.75 Percentage Change: -8.73% Day High: 6.64 Day Low: 5.8

Target met. If Hurrican Energy experiences continued weakness below 5.8, ……..

Subscribe for more

</p

View Previous Hurrican Energy & Big Picture ***

LSE:OXIG Oxford Instruments. Close Mid-Price: 1958 Percentage Change: + 0.93% Day High: 2025 Day Low: 1920

Weakness on Oxford Instruments below 1920 will invariably lead to 1825 wi ……..

Subscribe for more

</p

View Previous Oxford Instruments & Big Picture ***

LSE:RR. Rolls Royce. Close Mid-Price: 91.5 Percentage Change: + 4.32% Day High: 91.8 Day Low: 87.4

All Rolls Royce needs are mid-price trades ABOVE 91.8 to improve accelera ……..

Subscribe for more

</p

View Previous Rolls Royce & Big Picture ***

LSE:TW. Taylor Wimpey Close Mid-Price: 116.95 Percentage Change: -3.23% Day High: 121.5 Day Low: 116.3

In the event Taylor Wimpey experiences weakness below 116.3 it calculates ……..

Subscribe for more

</p

View Previous Taylor Wimpey & Big Picture ***

LSE:ZOO Zoo Digital Close Mid-Price: 101.5 Percentage Change: -0.98% Day High: 102.5 Day Low: 101.5

If Zoo Digital experiences continued weakness below 101.5, it will invari ……..

Subscribe for more

</p

View Previous Zoo Digital & Big Picture ***

*** End of “Updated Today” comments on shares.

Natwest and Moaning about Monday…

#Brent #Dax

We’re starting to think there’s something seriously wrong with the UK. Newspaper headlines make daily drama’s about the incompetence of our airports, the inability of the government to actually govern, but never talk about our Toyota SUV. It failed its MoT a month ago, needing a prop-shaft. The garage reported a fairly major issue.


Toyota were unable to say if they’d be able to supply one THIS YEAR, apparently an unexpected consequence of Brexit. This particular component was designed as “sealed for life” with Toyota believing, quite reasonably, it would last forever. Unfortunately, living in a stormy environment with the sea literally just across the road, our part of Scotland continually highlights flaws in manufacture. Sometimes it’s just the hinges of a garden gate falling apart, other times it’s the discovery our letter box has worn out, and I’ve still no idea where our fledging hydro electric generator eventually found itself, after our garden stream decided to “man up” following severe rainfall.

We’re used to things falling apart, we are not used to being unable to replace them! The prospect of having an expensive vehicle parked at the garage for months, awaiting parts, was quite worrying. This concern was further enhanced, the mechanic pointing to a row of dusty vehicles, all MoT failures, all awaiting parts from Europe and Japan. UK regulations ensure they can’t be driven as they’re officially unsafe and illegal on the road. Brexit is being blamed but, thinking about it, perhaps this is a consequence of the gap in the supply chain, the two year hole in time during the pandemic. It’s maybe the case in the UK, we’ve hit a perfect storm of excuses and it’s simply going to be a matter of patience.

Thankfully, a family member runs a specialist motor-sport engineering shop and offered to take a look at the Toyota prop-shaft. After a couple of days and a few hundred pounds, he rebuilt it and the car is now back on the road. Needless to say, he’s now contacting MoT garages to offer his services. An interesting codicil to this story, Toyota wanted £1,400 plus VAT for a replacement shaft!


However, the point from the foregoing is quite worrying. Something is distinctly wrong in the UK, prices are being driven up, stock markets are behaving quite badly, and rather than enjoy our usual optimistic attitude, we’re increasingly worried as to what to expect during the rest of this year. Worse, it’s not just the UK stock market behaving quite poorly, similar misbehaviour is being noted worldwide and the current loss of confidence in Bitcoin, recently thought of as a “safe haven”, is most emphatically not a UK problem.


With this seasoning of anxiety, we’ve some real concerns for the future of Natwest Group share price. Currently, below 215p risks triggering some reversal to an initial 201p. Such a target quite neatly matches the Red uptrend since 2020 and will hopefully provide sufficient excuse for some sort of bounce. However, should 201p break, our secondary calculates at 180p. This secondary ambition creates a painful visual problem, taking the share price below Red and into a zone where our third level drop target introduces itself at 116p.

We’d like to describe this third level as “ridiculous”, were it not for the unpleasant reality of it matching the lows of 2020.

If something is indeed “wrong” in the UK and we’re about to face some unpleasant market retreats, Natwest at 116p would certainly produce an excellent level from which to hope for a future rebound. Currently the share price requires exceed 235p to once again bring hope to the table as it’s easy to imagine a cycle to 270 and beyond commencing.

FUTURES

Time Issued Market Price At Issue Short Entry Fast Exit Slow Exit Stop Long Entry Fast Exit Slow Exit Stop
9:36:32PM BRENT 111.86 110 109.74 105.57 112.2 113.3 114.59 116.08 111.3
9:38:32PM GOLD 1840.33 1836
9:49:24PM FTSE 7006.19 7085
9:51:33PM FRANCE 5889.2 5920
9:53:22PM GERMANY 13166.88 12997 12905 12794 13136 13240 13285 13363 13140
9:54:41PM US500 3671 3665
10:12:30PM DOW 29870 29977
10:14:02PM NASDAQ 11262 11235
10:15:41PM JAPAN 26010 25945
17/06/2022 FTSE Closed at 7016 points. Change of -0.4%. Total value traded through LSE was: £ 12,344,389,846 a change of 36.38%
16/06/2022 FTSE Closed at 7044 points. Change of -3.15%. Total value traded through LSE was: £ 9,051,276,874 a change of 32.71%
15/06/2022 FTSE Closed at 7273 points. Change of 1.2%. Total value traded through LSE was: £ 6,820,318,073 a change of -14.4%
14/06/2022 FTSE Closed at 7187 points. Change of -0.25%. Total value traded through LSE was: £ 7,967,426,420 a change of 8.5%
13/06/2022 FTSE Closed at 7205 points. Change of -1.53%. Total value traded through LSE was: £ 7,343,380,444 a change of 22%
10/06/2022 FTSE Closed at 7317 points. Change of -2.13%. Total value traded through LSE was: £ 6,019,204,674 a change of -10.01%
9/06/2022 FTSE Closed at 7476 points. Change of -1.54%. Total value traded through LSE was: £ 6,688,998,845 a change of -1.03%

SUCCESS above means both FAST & SLOW targets were met. ‘CESS means just the FAST target met and probably the next time it is exceeded, movement to the SLOW target shall commence.

Our commentary is in two sections. Immediately below are today’s updated comments. If our commentary remains valid, the share can be found in the bottom section which has a RED heading. Hopefully, this will mean you no longer need to flip back through previous reports. HYPERLINKS DISABLED IN THIS VERSION

Please remember, all prices are mid-price (halfway between the Buy and Sell). When we refer to a price CLOSING above a specific level, we are viewing the point where we can regard a trend as changing. Otherwise, we are simply speculating on near term trading targets. Our website is www.trendsandtargets.com.

UPDATE. We often give an initial and a secondary price. If the initial is exceeded, we still expect it to fall back but the next time the initial is bettered, the price should continue to the secondary. The converse it true with price drops.

We can be contacted at info@trendsandtargets.com. Spam filters set to maximum so only legit emails get through…

Section One – Outlook Updated Today. Click here for Section Two – Outlook Remains Valid shares

Click Epic to jump to share: LSE:AVCT Avacta** **LSE:CBX Cellular Goods** **LSE:CCL Carnival** **LSE:DARK Darktrace Plc** **LSE:DDDD 4D Pharma** **LSE:FOXT Foxtons** **LSE:HUR Hurrican Energy** **LSE:IHG Intercontinental Hotels Group** **LSE:LLOY Lloyds Grp.** **LSE:NG. National Glib** **LSE:ZOO Zoo Digital** **

********

Updated charts published on : Avacta, Cellular Goods, Carnival, Darktrace Plc, 4D Pharma, Foxtons, Hurrican Energy, Intercontinental Hotels Group, Lloyds Grp., National Glib, Zoo Digital,

LSE:AVCT Avacta Close Mid-Price: 97.5 Percentage Change: -4.88% Day High: 103.5 Day Low: 94

Target met. In the event Avacta experiences weakness below 94 it calculat ……..

Subscribe for more

</p

View Previous Avacta & Big Picture ***

LSE:CBX Cellular Goods Close Mid-Price: 1.4 Percentage Change: -3.45% Day High: 1.45 Day Low: 1.4

Weakness on Cellular Goods below 1.4 will invariably lead to 0.8 with se ……..

Subscribe for more

</p

View Previous Cellular Goods & Big Picture ***

LSE:CCL Carnival. Close Mid-Price: 674.8 Percentage Change: + 3.05% Day High: 680.8 Day Low: 641

Weakness on Carnival below 641 will invariably lead to 560 with secondary ……..

Subscribe for more

</p

View Previous Carnival & Big Picture ***

LSE:DARK Darktrace Plc. Close Mid-Price: 324.4 Percentage Change: + 2.08% Day High: 326.5 Day Low: 288.8

If Darktrace Plc experiences continued weakness below 288.8, it will inva ……..

Subscribe for more

</p

View Previous Darktrace Plc & Big Picture ***

LSE:DDDD 4D Pharma Close Mid-Price: 23.3 Percentage Change: -2.10% Day High: 26.55 Day Low: 23

Continued weakness against DDDD taking the price below 23 calculates as l ……..

Subscribe for more

</p

View Previous 4D Pharma & Big Picture ***

LSE:FOXT Foxtons Close Mid-Price: 34.6 Percentage Change: -2.26% Day High: 35.75 Day Low: 34

In the event Foxtons experiences weakness below 34 it calculates with a d ……..

Subscribe for more

</p

View Previous Foxtons & Big Picture ***

LSE:HUR Hurrican Energy Close Mid-Price: 6.3 Percentage Change: -11.27% Day High: 7.32 Day Low: 6.39

In the event Hurrican Energy experiences weakness below 6.39 it calculate ……..

Subscribe for more

</p

View Previous Hurrican Energy & Big Picture ***

LSE:IHG Intercontinental Hotels Group. Close Mid-Price: 4252 Percentage Change: + 0.33% Day High: 4352 Day Low: 4226

Weakness on Intercontinental Hotels Group below 4226 will invariably lead ……..

Subscribe for more

</p

View Previous Intercontinental Hotels Group & Big Picture ***

LSE:LLOY Lloyds Grp.. Close Mid-Price: 42.26 Percentage Change: + 0.05% Day High: 43.28 Day Low: 41.97

In the event Lloyds Grp. experiences weakness below 41.97 it calculates w ……..

Subscribe for more

</p

View Previous Lloyds Grp. & Big Picture ***

LSE:NG. National Glib Close Mid-Price: 1033.5 Percentage Change: -0.96% Day High: 1052.5 Day Low: 1032.5

If National Glib experiences continued weakness below 1032.5, it will inv ……..

Subscribe for more

</p

View Previous National Glib & Big Picture ***

LSE:ZOO Zoo Digital Close Mid-Price: 102.5 Percentage Change: -0.97% Day High: 102.5 Day Low: 102.5

Continued weakness against ZOO taking the price below 102.5 calculates as ……..

Subscribe for more

</p

View Previous Zoo Digital & Big Picture ***

*** End of “Updated Today” comments on shares.

FTSE for Friday & Bitcoin hopes!

#FTSE #Gold

We reviewed #Bitcoin a month ago, speculating it was heading to $21,400. As hysteria in the media confirms, the crypto has indeed achieved this target level, ensuring the world has ended for some traders. However, we’ve spotted something which may prove important in the spiral to oblivion!


Regular readers will know we habitually give a primary, then a secondary, target.

The reason for this is pretty straightforward, generally a price will not go directly to a target level. Instead, sometimes it will stutter around the primary target until sufficient number of suckers believe it’s not dropping further. Then it drops further.

However, we always throw in an important caveat, generally suggesting “our secondary, if initial target is broken, works out at XYZ”. There’s a little more to this statement than just giving ourselves some wiggle room as it’s often critical how a price behaves at a target level, if we’re going to be given a clue to future behaviour. In the case of Bitcoin, our argument was along the lines of “If $21,410 breaks, our longer term secondary calculates at $13,800.

When we zoom in and look at how Bitcoin has behaved, there are a few interesting facets to the crypto fall from grace which perhaps imply it’s not intending a return to price levels last seen toward the end of 2020. With share prices, this sort of thing is a fairly big deal, so we’re obviously fascinated to see how the logic applies to crypto.

The chart extract above highlights something which may prove fascinating. The initial drop for Bitcoin failed to break our 21,400 target, instead bouncing (slightly) around 21,900. The next day. it indeed broke our target but closed above. Similarly on day three. Without a doubt, our target level has validity but it took a fourth session before Bitcoin finally immolated itself. When this sort of thing occurs with share prices, we tend toward considerable caution with expectations for our secondary to make an appearance. Instead, we start looking for early logic which shall indicate surprise recovery. At time of writing, Bitcoin is trading around 20,400, needing “only” to jump $2,000 above $22,400 to suggest it’s all been a bad dream and some recovery is happening!

Who knows, perhaps Bitcoin shall again surprise everyone…

FTSE for Friday

For a while in 2021, we quite liked the way the FTSE was behaving. Generally, the UK market was proving strong, while European markets were experiencing difficulty. Unfortunately, the UK has reverted to “type”, indulging in some truly awful dramatics just because everyone else is doing it. A graphic from the UK state broadcaster, the BBC, rather neatly encapsulates just how vile things are presently. It remains an ongoing puzzle just how Governments intend curb inflation by increasing interest rates, creating further pressure for prices to increase. Instead, why are Japan & China not being examined to discover the cause of their parsimonious inflation rates. If it means eating more rice, our household are completely on board as we already purchase Thai Jasmine rice by the 12kg sack. (We like rice)

The FTSE is certainly in a problematic position, breaking the uptrend since the Covid-19 low

and also failing to better the high of 2020, a point in time when ‘Pandemic’ was just a useful Scrabble word. More frightening, market movements during June are starting to feel dangerously reminiscent of 2008, a point in time which was quite scary. If that’s the case, we’re only perhaps witnessing the opening salvoes of some troubled times.

The immediate situation suggests weakness now below 7039 points threaten ongoing reversal to 7001 points, a market level at which we’d hope for a bounce – in normal circumstances. Our secondary, should the initial target break, calculates at 6782 points. We cannot suggest the secondary as a ‘longer term’ thing, thanks to current market movements proving painfully wide.


Our alternate scenario, if searching for gains, comes should the FTSE manage to exceed 7080 points as apparently, this risks triggering a surprise movement to 7136 points. Should this initial target be exceeded, our secondary calculates at 7200 points. This secondary level should prove a really big deal, given it matches the point of trend break. Market closure above such a level shall indicate, quite firmly, the immediate drop cycle is probably over.

FUTURES

Time Issued Market Price At Issue Short Entry Fast Exit Slow Exit Stop Long Entry Fast Exit Slow Exit Stop Prior
9:46:11PM BRENT 117.61 114 113.23 116.9 118.7 120.015 116.2 ‘cess
9:48:28PM GOLD 1857 1815 1780 1849 1858 1860 1843 Success
9:56:06PM FTSE 7022 6991 6939 7096 7116 7128 7043 Success
9:58:32PM FRANCE 5852 5835 5805 5908 5932 5938 5878 Success
10:01:05PM GERMANY 13013 12946 12874 13020 13162 13186 13066 Success
10:19:48PM US500 3676 3635 3616 3689 3690 3712 3648 Success
10:22:07PM DOW 30004 29732 29505 29907 30294 30501 30030 ‘cess
10:24:26PM NASDAQ 11177 11020 10887 11596 11463 11571 11235 ‘cess
10:28:15PM JAPAN 25715 25585 25486 25787 26055 26200 25700 Success
16/06/2022 FTSE Closed at 7044 points. Change of -3.15%. Total value traded through LSE was: £ 9,051,276,874 a change of 32.71%
15/06/2022 FTSE Closed at 7273 points. Change of 1.2%. Total value traded through LSE was: £ 6,820,318,073 a change of -14.4%
14/06/2022 FTSE Closed at 7187 points. Change of -0.25%. Total value traded through LSE was: £ 7,967,426,420 a change of 8.5%
13/06/2022 FTSE Closed at 7205 points. Change of -1.53%. Total value traded through LSE was: £ 7,343,380,444 a change of 22%
10/06/2022 FTSE Closed at 7317 points. Change of -2.13%. Total value traded through LSE was: £ 6,019,204,674 a change of -10.01%
9/06/2022 FTSE Closed at 7476 points. Change of -1.54%. Total value traded through LSE was: £ 6,688,998,845 a change of -1.03%
8/06/2022 FTSE Closed at 7593 points. Change of -0.07%. Total value traded through LSE was: £ 6,758,685,339 a change of -1.74%

SUCCESS above means both FAST & SLOW targets were met. ‘CESS means just the FAST target met and probably the next time it is exceeded, movement to the SLOW target shall commence.

Our commentary is in two sections. Immediately below are today’s updated comments. If our commentary remains valid, the share can be found in the bottom section which has a RED heading. Hopefully, this will mean you no longer need to flip back through previous reports. HYPERLINKS DISABLED IN THIS VERSION

Please remember, all prices are mid-price (halfway between the Buy and Sell). When we refer to a price CLOSING above a specific level, we are viewing the point where we can regard a trend as changing. Otherwise, we are simply speculating on near term trading targets. Our website is www.trendsandtargets.com.

UPDATE. We often give an initial and a secondary price. If the initial is exceeded, we still expect it to fall back but the next time the initial is bettered, the price should continue to the secondary. The converse it true with price drops.

We can be contacted at info@trendsandtargets.com. Spam filters set to maximum so only legit emails get through…

Section One – Outlook Updated Today. Click here for Section Two – Outlook Remains Valid shares

Click Epic to jump to share: LSE:AML Aston Martin** **LSE:ASC Asos** **LSE:CCL Carnival** **LSE:DDDD 4D Pharma** **LSE:EXPN Experian** **LSE:HIK Hikma** **LSE:HL. Hargreaves Lansdown** **LSE:HUR Hurrican Energy** **LSE:IAG British Airways** **LSE:IHG Intercontinental Hotels Group** **LSE:IPF International Personal Finance** **LSE:ITM ITM Power** **LSE:ITRK Intertek** **LSE:ITV ITV** **LSE:JET Just Eat** **LSE:LLOY Lloyds Grp.** **LSE:MKS Marks and Spencer** **LSE:OXIG Oxford Instruments** **LSE:RKH Rockhopper** **LSE:SPX Spirax** **

********

Updated charts published on : Aston Martin, Asos, Carnival, 4D Pharma, Experian, Hikma, Hargreaves Lansdown, Hurrican Energy, British Airways, Intercontinental Hotels Group, International Personal Finance, ITM Power, Intertek, ITV, Just Eat, Lloyds Grp., Marks and Spencer, Rockhopper, Spirax,

LSE:AML Aston Martin Close Mid-Price: 468.7 Percentage Change: -8.13% Day High: 516.6 Day Low: 466.3

Target met. If Aston Martin experiences continued weakness below 466.3, i ……..

Subscribe for more

</p

View Previous Aston Martin & Big Picture ***

LSE:ASC Asos Close Mid-Price: 783.5 Percentage Change: -32.46% Day High: 1040 Day Low: 775

Target met. Weakness on Asos below 775 will invariably lead to 645 with s ……..

Subscribe for more

</p

View Previous Asos & Big Picture ***

LSE:CCL Carnival Close Mid-Price: 654.8 Percentage Change: -10.08% Day High: 730.4 Day Low: 652.8

Target met. Continued weakness against CCL taking the price below 652.8 c ……..

Subscribe for more

</p

View Previous Carnival & Big Picture ***

LSE:DDDD 4D Pharma Close Mid-Price: 23.8 Percentage Change: -7.21% Day High: 26.15 Day Low: 23.25

Weakness on 4D Pharma below 23.25 will invariably lead to 18 with seconda ……..

Subscribe for more

</p

View Previous 4D Pharma & Big Picture ***

LSE:EXPN Experian Close Mid-Price: 2293 Percentage Change: -2.47% Day High: 2344 Day Low: 2266

Continued weakness against EXPN taking the price below 2266 calculates as ……..

Subscribe for more

</p

View Previous Experian & Big Picture ***

LSE:HIK Hikma Close Mid-Price: 1485 Percentage Change: -2.17% Day High: 1515.5 Day Low: 1466

In the event Hikma experiences weakness below 1466 it calculates with a d ……..

Subscribe for more

</p

View Previous Hikma & Big Picture ***

LSE:HL. Hargreaves Lansdown Close Mid-Price: 762.6 Percentage Change: -3.42% Day High: 787.6 Day Low: 760

Weakness on Hargreaves Lansdown below 760 will invariably lead to 513 wit ……..

Subscribe for more

</p

View Previous Hargreaves Lansdown & Big Picture ***

LSE:HUR Hurrican Energy Close Mid-Price: 7.1 Percentage Change: -4.05% Day High: 7.93 Day Low: 6.74

Continued weakness against HUR taking the price below 6.74 calculates as ……..

Subscribe for more

</p

View Previous Hurrican Energy & Big Picture ***

LSE:IAG British Airways Close Mid-Price: 109.22 Percentage Change: -7.20% Day High: 118.24 Day Low: 109.48

In the event British Airways experiences weakness below 109.48 it calcul ……..

Subscribe for more

</p

View Previous British Airways & Big Picture ***

LSE:IHG Intercontinental Hotels Group Close Mid-Price: 4238 Percentage Change: -4.70% Day High: 4431 Day Low: 4231

If Intercontinental Hotels Group experiences continued weakness below 423 ……..

Subscribe for more

</p

View Previous Intercontinental Hotels Group & Big Picture ***

LSE:IPF International Personal Finance. Close Mid-Price: 76.8 Percentage Change: + 0.39% Day High: 76.9 Day Low: 75.5

Weakness on International Personal Finance below 75.5 will invariably lea ……..

Subscribe for more

</p

View Previous International Personal Finance & Big Picture ***

LSE:ITM ITM Power Close Mid-Price: 205.8 Percentage Change: -3.33% Day High: 219.2 Day Low: 201.4

Continued weakness against ITM taking the price below 201.4 calculates as ……..

Subscribe for more

</p

View Previous ITM Power & Big Picture ***

LSE:ITRK Intertek Close Mid-Price: 4202 Percentage Change: -1.18% Day High: 4231 Day Low: 4141

In the event Intertek experiences weakness below 4141 it calculates with ……..

Subscribe for more

</p

View Previous Intertek & Big Picture ***

LSE:ITV ITV Close Mid-Price: 65.24 Percentage Change: -6.83% Day High: 70.28 Day Low: 64.88

Continued weakness against ITV taking the price below 64.88 calculates as ……..

Subscribe for more

</p

View Previous ITV & Big Picture ***

LSE:JET Just Eat Close Mid-Price: 1369.2 Percentage Change: -10.15% Day High: 1507.8 Day Low: 1356.2

Target met. Weakness on Just Eat below 1356.2 will invariably lead to 130 ……..

Subscribe for more

</p

View Previous Just Eat & Big Picture ***

LSE:LLOY Lloyds Grp. Close Mid-Price: 42.24 Percentage Change: -4.14% Day High: 44.12 Day Low: 42.16

Continued weakness against LLOY taking the price below 42.16 calculates a ……..

Subscribe for more

</p

View Previous Lloyds Grp. & Big Picture ***

LSE:MKS Marks and Spencer Close Mid-Price: 132.5 Percentage Change: -4.71% Day High: 137.9 Day Low: 129.6

In the event Marks and Spencer experiences weakness below 129.6 it calcul ……..

Subscribe for more

</p

View Previous Marks and Spencer & Big Picture ***

LSE:OXIG Oxford Instruments Close Mid-Price: 1986 Percentage Change: -8.48% Day High: 2165 Day Low: 1956

Target met. If Oxford Instruments experiences continued weakness below 19 ……..

Subscribe for more

</p

View Previous Oxford Instruments & Big Picture ***

LSE:RKH Rockhopper Close Mid-Price: 7.25 Percentage Change: -8.92% Day High: 7.3 Day Low: 6.94

Target met. Weakness on Rockhopper below 6.94 will invariably lead to 6p ……..

Subscribe for more

</p

View Previous Rockhopper & Big Picture ***

LSE:SPX Spirax Close Mid-Price: 9168 Percentage Change: -3.45% Day High: 9456 Day Low: 9048

In the event Spirax experiences weakness below 9048 it calculates with a ……..

Subscribe for more

</p

View Previous Spirax & Big Picture ***

*** End of “Updated Today” comments on shares.

EasyJet, a Head & Shoulders in waiting???

#Gold #CAC40

Sometimes, it’s worth decluttering your charts in case you’re missing something obvious. Aside from ditching ALL technical indicators, just change the chart type to “Line”, zoom out and take a 5+ year view, and think about what you’re seeing. Currently EasyJet provide a perfect example for this stance, albeit not a particularly comfortable example.

The chart below for EZJ dates back to 2009 and, hopefully obviously, there are a couple of items worthy of consideration. The current narrative among shares is “buy while they’re cheap” but, with Easyjet, we’re pretty far from convinced the budget airline is offering a share price which matches their alleged ticket policy.


The first thing which should be noticed is the current share price. By turning off “candles”, it becomes immediately clear the share is achieving “lower lows”, perhaps one of the biggest warning bells a share can ring. The chart below, showing Easyjet with “candles” turned on manages to utterly conceal the harsh reality of recent movements.

Secondly, there’s the small matter of a potential Head and Shoulders making itself known. Generally, we ridicule chart patterns but this one is deserving of respect, roughly 2/3rds of the time. Since the Covid-19 pandemic low of 2020, it’s possible Easyjet has painted this dangerous pattern. To be honest, Easyjet are far from alone in describing such a trajectory since the pandemic hit. It’s currently the case Bitcoin appear to be reaping the rewards of a similar trade history.


The chart below shows Easyjet, this time with candles turned on. Just to add confusion, we’ve chosen to Red circle the major share price manipulation gaps since 2020. At a glance, it’s obvious the market has chosen to force the share price down with a greater frequency than the UK Government has offered flights to Rwanda. On 10 out of 13 circles, the market has gapped the price downward, almost feeling like there may be a wish to drive Easyjet lower.

This being the case, the current situation suggests weakness below 408p risks triggering reversal to 334p next and hopefully a bounce. Below 334p and we’ll start to suspect the effect of the previously mentioned Head & Shoulders formation is kicking into play, our secondary target calculating at a ridiculous looking 38p.

For Easyjet to ascend out of trouble, the share price needs exceed Blue on the chart, currently around 600p as this should trigger gains to an initial 709p with secondary, if bettered, at a game changing 773p.


FUTURES

Time Issued Market Price At Issue Short Entry Fast Exit Slow Exit Stop Long Entry Fast Exit Slow Exit Stop Prior
9:53:26PM BRENT 117.22
9:55:36PM GOLD 1835.92 1813 1804 1792 1829 1842 1845 1858 1826 Success
10:00:31PM FTSE 7287.26 ‘cess
10:02:54PM FRANCE 6056 5968 5922 5862 6052 6102 6125 6156 6030 ‘cess
10:14:58PM GERMANY 13551 Success
10:17:07PM US500 3791.65 ‘cess
10:25:33PM DOW 30691.9 Success
10:27:27PM NASDAQ 11608 Success
10:29:17PM JAPAN 26563
15/06/2022 FTSE Closed at 7273 points. Change of 1.2%. Total value traded through LSE was: £ 6,820,318,073 a change of -14.4%
14/06/2022 FTSE Closed at 7187 points. Change of -0.25%. Total value traded through LSE was: £ 7,967,426,420 a change of 8.5%
13/06/2022 FTSE Closed at 7205 points. Change of -1.53%. Total value traded through LSE was: £ 7,343,380,444 a change of 22%
10/06/2022 FTSE Closed at 7317 points. Change of -2.13%. Total value traded through LSE was: £ 6,019,204,674 a change of -10.01%
9/06/2022 FTSE Closed at 7476 points. Change of -1.54%. Total value traded through LSE was: £ 6,688,998,845 a change of -1.03%
8/06/2022 FTSE Closed at 7593 points. Change of -0.07%. Total value traded through LSE was: £ 6,758,685,339 a change of -1.74%
7/06/2022 FTSE Closed at 7598 points. Change of -100%. Total value traded through LSE was: £ 6,878,313,102 a change of 0%

SUCCESS above means both FAST & SLOW targets were met. ‘CESS means just the FAST target met and probably the next time it is exceeded, movement to the SLOW target shall commence.

Our commentary is in two sections. Immediately below are today’s updated comments. If our commentary remains valid, the share can be found in the bottom section which has a RED heading. Hopefully, this will mean you no longer need to flip back through previous reports. HYPERLINKS DISABLED IN THIS VERSION

Please remember, all prices are mid-price (halfway between the Buy and Sell). When we refer to a price CLOSING above a specific level, we are viewing the point where we can regard a trend as changing. Otherwise, we are simply speculating on near term trading targets. Our website is www.trendsandtargets.com.

UPDATE. We often give an initial and a secondary price. If the initial is exceeded, we still expect it to fall back but the next time the initial is bettered, the price should continue to the secondary. The converse it true with price drops.

We can be contacted at info@trendsandtargets.com. Spam filters set to maximum so only legit emails get through…

Section One – Outlook Updated Today. Click here for Section Two – Outlook Remains Valid shares

Click Epic to jump to share: LSE:AML Aston Martin** **LSE:CCL Carnival** **LSE:IPF International Personal Finance** **LSE:NG. National Glib** **LSE:RR. Rolls Royce** **LSE:SPX Spirax** **

********

Updated charts published on : Aston Martin, Carnival, International Personal Finance, National Glib, Rolls Royce, Spirax,

LSE:AML Aston Martin Close Mid-Price: 510.2 Percentage Change: -0.74% Day High: 534.2 Day Low: 501

Weakness on Aston Martin below 501 will invariably lead to 472 with secon ……..

Subscribe for more

</p

View Previous Aston Martin & Big Picture ***

LSE:CCL Carnival. Close Mid-Price: 728.2 Percentage Change: + 0.52% Day High: 738.8 Day Low: 713.6

In the event Carnival experiences weakness below 713.6 it calculates with ……..

Subscribe for more

</p

View Previous Carnival & Big Picture ***

LSE:IPF International Personal Finance Close Mid-Price: 76.5 Percentage Change: -4.26% Day High: 82 Day Low: 77.6

If International Personal Finance experiences continued weakness below 77 ……..

Subscribe for more

</p

View Previous International Personal Finance & Big Picture ***

LSE:NG. National Glib. Close Mid-Price: 1058 Percentage Change: + 0.71% Day High: 1070.5 Day Low: 1038.5

Weakness on National Glib below 1038.5 will invariably lead to 953 with s ……..

Subscribe for more

</p

View Previous National Glib & Big Picture ***

LSE:RR. Rolls Royce. Close Mid-Price: 90.69 Percentage Change: + 3.15% Day High: 91.68 Day Low: 87.71

In the event of Rolls Royce enjoying further trades beyond 91.7, the shar ……..

Subscribe for more

</p

View Previous Rolls Royce & Big Picture ***

LSE:SPX Spirax. Close Mid-Price: 9496 Percentage Change: + 2.28% Day High: 9512 Day Low: 9086

Target met. Continued weakness against SPX taking the price below 9086 ca ……..

Subscribe for more

</p

View Previous Spirax & Big Picture ***

*** End of “Updated Today” comments on shares.