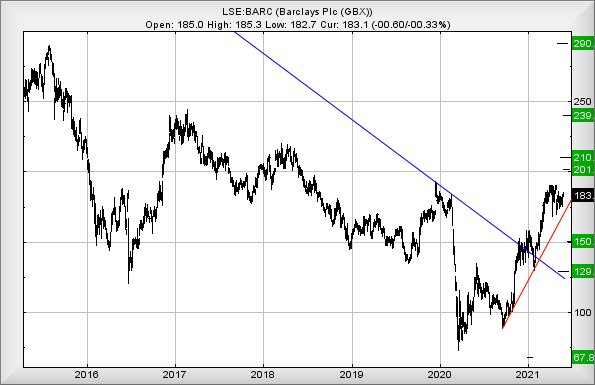
#Brent #Dax When we reviewed Barclays 3 weeks ago, we were breathlessly enthusiastic as to the share price prospects, if it would only exceed 191p. Presently trading around 183p, a visit to our trigger level was studiously avoided. Perhaps Boris celebrating his wedding and granting a weekend of good weather to a grateful nation shall do the trick! Or maybe not…
The trigger level for movement has melted downward, now standing at 188p.
Our software claims movements above 188p should now provoke price recovery to an initial 201p with secondary, if exceeded, calculating at 210p. A glance at the chart below reveals both ambitions take the share price solidly into Big Picture territory, a region where an iota above 210p can expect longer term price recovery toward 290p eventually. We can all hope something will get the party started. Our own preference shall be the market opting to “gap” the share price upward at the open anytime soon, ideally by around 10p above current. This will certainly broadcast a strong suggestion a recovery cycle is commencing, one where our Big Picture ambitions shall start to make sense.
One little puzzle has been recent news Barclays introduced restrictions on clients ability to transfer money to the leading crypto currency exchanges. Our curiosity is awakened as we cannot see how the bank intend make money from this maneuver. Unless we’re about to see crypto-currency exchanges run by the banks in the UK, perhaps intended to produce a respectable way of trading Bitcoin etc, allowing the current restrictions to be lifted. Despite the PR headlines advising the banks have introduced this restriction to protect their clients money, we’re more than a little suspicious as to Barclays real motives as banks rarely act in the best interest of clients, their own bottom line generally providing the driving force for decisions.
If everything intends go wrong for Barclays share price, it looks like below 169p shall prove troublesome, allowing the potential of weakness to an initial 150p. If broken, our longer term secondary calculates at 129p. Nothing is currently pointing in this direction. Hopefully Boris doesn’t award the nation with another lockdown, allowing him to drive to Barnard Castle in peace and quiet for a honeymoon.
All kidding aside, as someone who stays in a “destination” area, this holiday weekend allowed an amazing invasion of visitors. It also provided a sharp reminder of tourists being utterly incompetent when driving on “single track” roads, an entire field of highland cows opting to use a crash damaged fence to explore the wider area.
Once again, many thanks to those who find interesting adverts on this page.

FUTURES
| Time Issued | Market | Price At Issue | Short Entry | Fast Exit | Slow Exit | Stop | Long Entry | Fast Exit | Slow Exit | Stop |
| 10:08:10PM | BRENT | 69.47 | 68.61 | 68.315 | 67.83 | 69.15 | 69.77 | 69.925 | 70.38 | 69.1 |
| 10:10:35PM | GOLD | 1907.62 | 1901 | |||||||
| 10:12:50PM | FTSE | 7005.71 | 6996 | |||||||
| 10:14:42PM | FRANCE | 6447.8 | 6439 | |||||||
| 10:26:16PM | GERMANY | 15443 | 15409 | 15374 | 15315 | 15483 | 15550 | 15587.5 | 15647 | 15455 |
| 10:27:52PM | US500 | 4193 | 4203 | |||||||
| 10:29:57PM | DOW | 34459 | 34515 | |||||||
| 10:31:57PM | NASDAQ | 13658 | 13673 | |||||||
| 10:33:26PM | JAPAN | 28905 | 29000 |
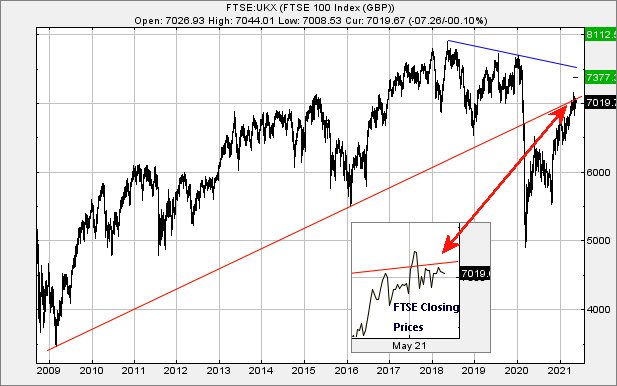
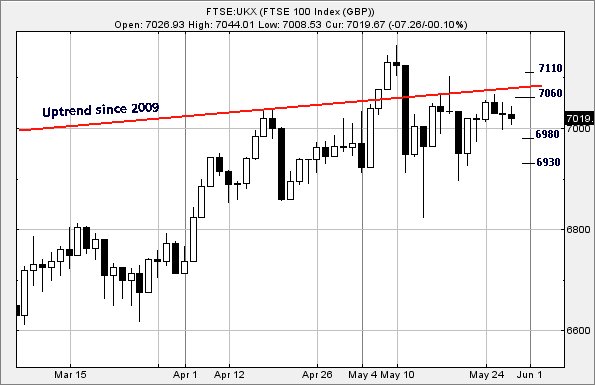
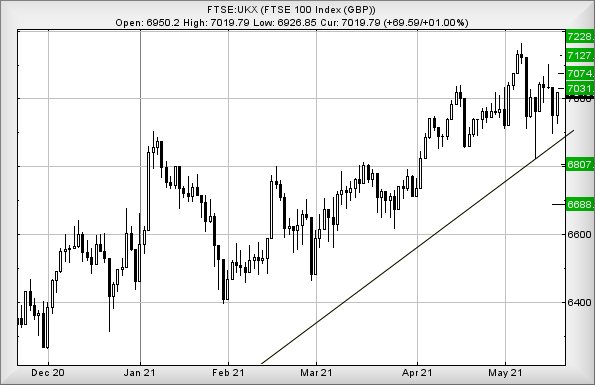
28/05/2021 FTSE Closed at 7022 points. Change of 0.04%. Total value traded through LSE was: £ 6,029,889,894 a change of -45.96%
27/05/2021 FTSE Closed at 7019 points. Change of -0.1%. Total value traded through LSE was: £ 11,159,138,786 a change of 114.44%
26/05/2021 FTSE Closed at 7026 points. Change of -0.04%. Total value traded through LSE was: £ 5,203,804,555 a change of -0.88%
25/05/2021 FTSE Closed at 7029 points. Change of -0.31%. Total value traded through LSE was: £ 5,249,852,674 a change of 45.96%
24/05/2021 FTSE Closed at 7051 points. Change of 0.47%. Total value traded through LSE was: £ 3,596,890,836 a change of -36.82%
21/05/2021 FTSE Closed at 7018 points. Change of -0.03%. Total value traded through LSE was: £ 5,693,397,928 a change of 0.83%
20/05/2021 FTSE Closed at 7020 points. Change of 1.01%. Total value traded through LSE was: £ 5,646,307,617 a change of -4.36%
SUCCESS above means both FAST & SLOW targets were met. ‘CESS means just the FAST target met and probably the next time it is exceeded, movement to the SLOW target shall commence.
Our commentary is in two sections. Immediately below are today’s updated comments. If our commentary remains valid, the share can be found in the bottom section which has a RED heading. Hopefully, this will mean you no longer need to flip back through previous reports. HYPERLINKS DISABLED IN THIS VERSION
Please remember, all prices are mid-price (halfway between the Buy and Sell). When we refer to a price CLOSING above a specific level, we are viewing the point where we can regard a trend as changing. Otherwise, we are simply speculating on near term trading targets. Our website is www.trendsandtargets.com.
UPDATE. We often give an initial and a secondary price. If the initial is exceeded, we still expect it to fall back but the next time the initial is bettered, the price should continue to the secondary. The converse it true with price drops.
We can be contacted at info@trendsandtargets.com. Spam filters set to maximum so only legit emails get through…
Section One – Outlook Updated Today. Click here for Section Two – Outlook Remains Valid shares
Click Epic to jump to share: LSE:AML Aston Martin** **LSE:BBY BALFOUR BEATTY** **LSE:CCL Carnival** **LSE:CEG Challenger Energy (aka Bahamas Pet)** **LSE:EMG MAN** **LSE:HSBA HSBC** **LSE:IGAS Igas Energy** **LSE:LLOY Lloyds Grp.** **LSE:NWG Natwest** **LSE:PMG Parkmead** **LSE:SPX Spirax** **LSE:STAN Standard Chartered** **
********
Updated charts published on : Aston Martin, BALFOUR BEATTY, Carnival, MAN, HSBC, Igas Energy, Lloyds Grp., Natwest, Parkmead, Spirax, Standard Chartered,
LSE:AML Aston Martin Close Mid-Price: 2106 Percentage Change: -0.80% Day High: 2178 Day Low: 2098
Further movement against Aston Martin ABOVE 2178 should improve accelerat ……..
</p
View Previous Aston Martin & Big Picture ***
LSE:BBY BALFOUR BEATTY. Close Mid-Price: 310.8 Percentage Change: + 0.26% Day High: 313.4 Day Low: 303.6
Below 300 looks capable of an initial 293 with secondary, when broken, at ……..
</p
View Previous BALFOUR BEATTY & Big Picture ***
LSE:CCL Carnival. Close Mid-Price: 1765.4 Percentage Change: + 1.01% Day High: 1791.8 Day Low: 1754
In the event of Carnival enjoying further trades beyond 1791.8, the share ……..
</p
View Previous Carnival & Big Picture ***
LSE:CEG Challenger Energy (aka Bahamas Pet) Close Mid-Price: 3.05 Percentage Change: -12.86% Day High: 3.5 Day Low: 1.66
??? ……..
</p
View Previous Challenger Energy (aka Bahamas Pet) & Big Picture ***
LSE:EMG MAN. Close Mid-Price: 178.2 Percentage Change: + 0.99% Day High: 179.85 Day Low: 176.8
Further movement against MAN ABOVE 179.85 should improve acceleration tow ……..
</p
View Previous MAN & Big Picture ***
LSE:HSBA HSBC. Close Mid-Price: 455.3 Percentage Change: + 1.13% Day High: 462 Day Low: 453.95
All HSBC needs are mid-price trades ABOVE 462 to improve acceleration tow ……..
</p
View Previous HSBC & Big Picture ***
LSE:IGAS Igas Energy Close Mid-Price: 16.9 Percentage Change: -5.06% Day High: 17.8 Day Low: 16.2
In the event Igas Energy experiences weakness below 16.2 it calculates wi ……..
</p
View Previous Igas Energy & Big Picture ***
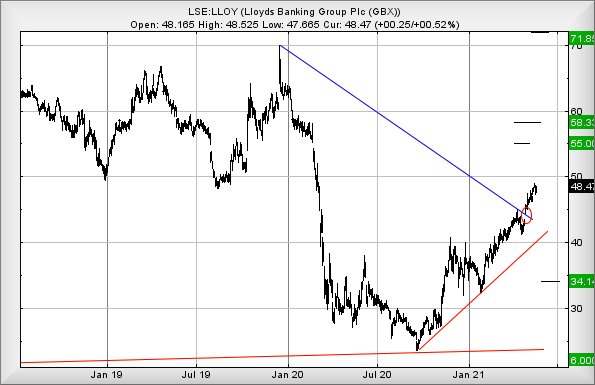
LSE:LLOY Lloyds Grp. Close Mid-Price: 49.89 Percentage Change: -0.03% Day High: 50.1 Day Low: 49.51
Continued trades against LLOY with a mid-price ABOVE 50.1 should improve ……..
</p
View Previous Lloyds Grp. & Big Picture ***
LSE:NWG Natwest. Close Mid-Price: 207 Percentage Change: + 0.53% Day High: 209.1 Day Low: 206.4
Continued trades against NWG with a mid-price ABOVE 209.1 should improve ……..
</p
View Previous Natwest & Big Picture ***
LSE:PMG Parkmead. Close Mid-Price: 42.45 Percentage Change: + 3.54% Day High: 0 Day Low: 0
It appears writ large, movement next below 41p should attempt reversal to ……..
</p
View Previous Parkmead & Big Picture ***
LSE:SPX Spirax Close Mid-Price: 12700 Percentage Change: -0.55% Day High: 12810 Day Low: 12645
Target met. In the event of Spirax enjoying further trades beyond 12810, ……..
</p
View Previous Spirax & Big Picture ***
LSE:STAN Standard Chartered. Close Mid-Price: 507.8 Percentage Change: + 0.24% Day High: 516.6 Day Low: 508
This is starting to exhibit mildly hopeful symptoms of some optimism for t ……..
</p
View Previous Standard Chartered & Big Picture ***