#Gold #DOW
When an email asked us to take a look at this organisation, we were surprised we’d never reviewed them before. This, obviously, demanded our usual visit to the company website, along with a surprise doze of common sense. The implicit suggestion, to avoid placing all your eggs in a specialist miner, makes a lot of sense. To quote them;
“The mining sector is benefiting from the world’s most compelling long-term trends from digital transformation, to the sustainability agenda, to gold and precious metals. Targeting income and capital growth, the Trust provides a diversified blend of companies designed to benefit from the changing global economy.”
and further down the page;
“Mining shares typically experience above average volatility when compared to other investments. Trends which occur within the general equity market may not be mirrored within mining securities”
It’d be true to admit we were delighted at the lack of “corporate buzzword driven gibberish” from the company website. Instead, the tone was basically; this is us, this is what we do, and there’s an inevitable caveat. The world markets and the value of investments can fall as well as rise. There are no guarantees!
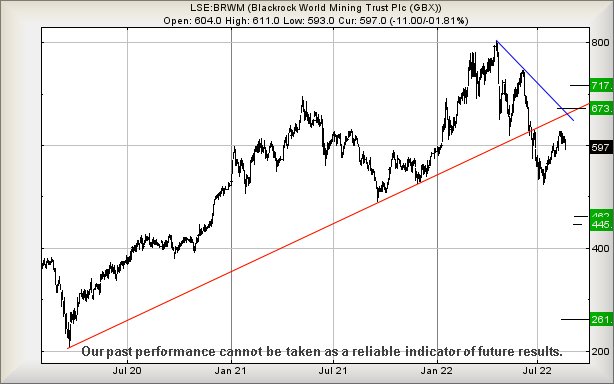
Currently, their share price appears slightly becalmed in the torpor of August, presently trading around 597p and carefully avoiding exceeding the point of trend-break from June, where the share price trashed the Red uptrend and dropped a bit. It’s mildly interesting, the share price level when Red broke was 631p and in the months since, this level has been approached but not exceeded. From our perspective, this tends suggest the risk of reversal remains real and we shall be naive to assume a potential visit to an initial 462p with secondary, if broken, at 445p, should be ignored. Below 524p shall suggest this is inevitable but, getting real, we’d be quite nervous currently unless the price exceeds 631p. Such a movement would foul with our reversal calculations, especially as the share price is presently trading in a region where our “ultimate” drop potential of 261p works out as possible but visually, not very probable. We’ve noticed few shares are “testing” their Covid-19 drop levels and instead, the ones to spark fear are those where we start calculating lower!
For things to become interesting, BRWM needs confirm its intent by actually closing a session above 631p. Such a movement would force us to concede movement above 631p provides the potential of price recovery to an initial 673p with secondary, if exceeded, a more useful 717p.
FUTURES
| Time Issued | Market | Price At Issue | Short Entry | Fast Exit | Slow Exit | Stop | Long Entry | Fast Exit | Slow Exit | Stop | Prior |
| 10:00:31PM | BRENT | 96.21 | ‘cess | ||||||||
| 10:08:06PM | GOLD | 1736.53 | 1727 | 1721 | 1700 | 1738 | 1740 | 1744 | 1749 | 1733 | ‘cess |
| 10:11:19PM | FTSE | 7526.48 | Shambles | ||||||||
| 10:14:05PM | STOX50 | 3654 | Success | ||||||||
| 10:17:39PM | GERMANY | 13216 | Success | ||||||||
| 10:27:54PM | US500 | 4145.77 | Success | ||||||||
| 10:31:09PM | DOW | 33120 | 33007 | 32779 | 32743 | 33214 | 33450 | 33478 | 33635 | 33253 | Success |
| 10:34:07PM | NASDAQ | 12919 | Success | ||||||||
| 10:37:03PM | JAPAN | 28484 | Success |
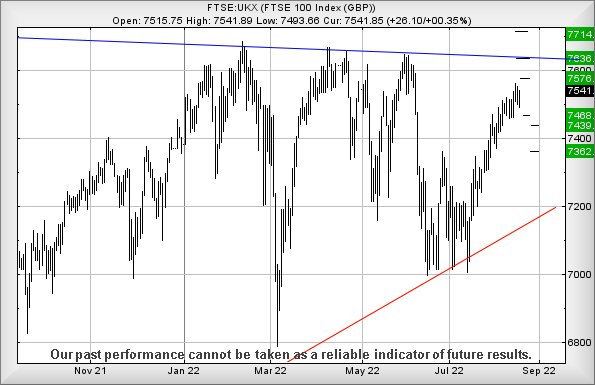
22/08/2022 FTSE Closed at 7533 points. Change of -0.23%. Total value traded through LSE was: £ 4,973,471,266 a change of -16.58%
19/08/2022 FTSE Closed at 7550 points. Change of 0.12%. Total value traded through LSE was: £ 5,961,629,196 a change of 29.52%
18/08/2022 FTSE Closed at 7541 points. Change of 0.35%. Total value traded through LSE was: £ 4,602,765,684 a change of 0.38%
17/08/2022 FTSE Closed at 7515 points. Change of -0.28%. Total value traded through LSE was: £ 4,585,359,451 a change of 5.45%
16/08/2022 FTSE Closed at 7536 points. Change of 0.36%. Total value traded through LSE was: £ 4,348,545,250 a change of 13.62%
15/08/2022 FTSE Closed at 7509 points. Change of 0.12%. Total value traded through LSE was: £ 3,827,179,402 a change of -9.76%
12/08/2022 FTSE Closed at 7500 points. Change of 0.47%. Total value traded through LSE was: £ 4,240,976,226 a change of -17.45%
SUCCESS above means both FAST & SLOW targets were met. ‘CESS means just the FAST target met and probably the next time it is exceeded, movement to the SLOW target shall commence.
Our commentary is in two sections. Immediately below are today’s updated comments. If our commentary remains valid, the share can be found in the bottom section which has a RED heading. Hopefully, this will mean you no longer need to flip back through previous reports. HYPERLINKS DISABLED IN THIS VERSION
Please remember, all prices are mid-price (halfway between the Buy and Sell). When we refer to a price CLOSING above a specific level, we are viewing the point where we can regard a trend as changing. Otherwise, we are simply speculating on near term trading targets. Our website is www.trendsandtargets.com.
UPDATE. We often give an initial and a secondary price. If the initial is exceeded, we still expect it to fall back but the next time the initial is bettered, the price should continue to the secondary. The converse it true with price drops.
We can be contacted at info@trendsandtargets.com. Spam filters set to maximum so only legit emails get through…
Section One – Outlook Updated Today. Click here for Section Two – Outlook Remains Valid shares
Click Epic to jump to share: LSE:ASC Asos** **LSE:AZN Astrazeneca** **LSE:BP. BP PLC** **LSE:CPI Capita** **LSE:HIK Hikma** **LSE:IAG British Airways** **LSE:ITM ITM Power** **LSE:NG. National Glib** **LSE:ODX Omega Diags** **LSE:SMT Scottish Mortgage Investment Trust** **
********
Updated charts published on : Asos, Astrazeneca, BP PLC, Capita, Hikma, British Airways, ITM Power, National Glib, Omega Diags, Scottish Mortgage Investment Trust,
LSE:ASC Asos Close Mid-Price: 752.5 Percentage Change: -1.63% Day High: 807.5 Day Low: 751
Yup, still unhappy with weakness next below 751 pointing at 670 next with ……..
</p
View Previous Asos & Big Picture ***
LSE:AZN Astrazeneca. Close Mid-Price: 11440 Percentage Change: + 1.69% Day High: 11518 Day Low: 11242
All Astrazeneca needs are mid-price trades ABOVE 11518 to continue acceler ……..
</p
View Previous Astrazeneca & Big Picture ***
LSE:BP. BP PLC. Close Mid-Price: 449 Percentage Change: + 0.27% Day High: 452.45 Day Low: 440
Target Met or near enuff. BP PLC needs are mid-price trades ABOVE 454 to c ……..
</p
View Previous BP PLC & Big Picture ***
LSE:CPI Capita Close Mid-Price: 25.24 Percentage Change: -0.55% Day High: 25.5 Day Low: 25
Getting dodgy, below 25 now suggests weakness to an initial 20.5 with seco ……..
</p
View Previous Capita & Big Picture ***
LSE:HIK Hikma Close Mid-Price: 1394.5 Percentage Change: -3.06% Day High: 1439 Day Low: 1389.5
Target Met. That was a bit nasty. Weakness continuing below 1389 now looks ……..
</p
View Previous Hikma & Big Picture ***
LSE:IAG British Airways Close Mid-Price: 107.46 Percentage Change: -4.53% Day High: 112.06 Day Low: 107.34
Now especially troubling, below 107 points at a descent to an initial 99 w ……..
</p
View Previous British Airways & Big Picture ***
LSE:ITM ITM Power Close Mid-Price: 198.7 Percentage Change: -2.84% Day High: 208.3 Day Low: 193.35
Weakness on ITM Power below 193 will invariably now lead to 182 with secon ……..
</p
View Previous ITM Power & Big Picture ***
LSE:NG. National Glib. Close Mid-Price: 1185 Percentage Change: + 1.41% Day High: 1185 Day Low: 1166.5
Continued trades against NG. with a mid-price ABOVE 1185 should improve th ……..
</p
View Previous National Glib & Big Picture ***
LSE:ODX Omega Diags Close Mid-Price: 2.85 Percentage Change: -4.20% Day High: 2.98 Day Low: 2.85
Continued weakness against ODX taking the price below 2.85 calculates as l ……..
</p
View Previous Omega Diags & Big Picture ***
LSE:SMT Scottish Mortgage Investment Trust Close Mid-Price: 822.8 Percentage Change: -4.57% Day High: 858.8 Day Low: 825
If Scottish Mortgage Investment Trust experiences continued weakness belo ……..
</p
View Previous Scottish Mortgage Investment Trust & Big Picture ***