#Gold #FTSE
Here in our bit of Argyll, the last two mornings have been fascinating. When daylight grudgingly makes an appearance around 08.30am, the flat calm sea has been frozen, quite literally covering the two miles across to the local marina. Given recent rainfalls, it’s easy to speculate hell actually has frozen over! But there’s perhaps a silver lining, online retailers perhaps facing a surge in demand for warmer clothing. It’s funny how “price resistance” becomes less important, the colder it gets.
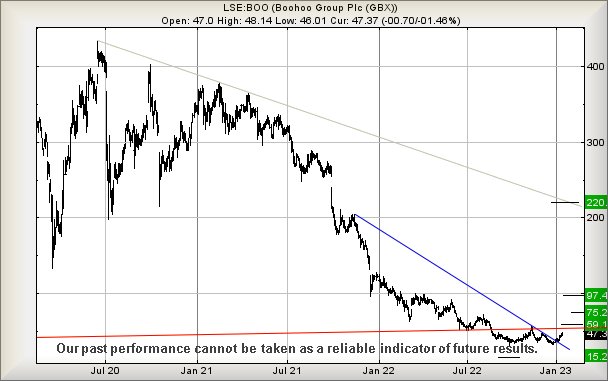
We’re curious whether clothing retailer Boohoo are poised to release some positive numbers for the winter/festive season. It already appears “the market” has some expectations as, for instance, last September we promised all sorts of doom and gloom, if their share price broke below 30p. It didn’t.
Instead, the price has eventually toddled off in a more positive direction, already spiking to our initial 47p target and exceeding it quite nicely, topping out at 56p before being forced back down toward the 30 level again. With the share price starting 2023 by breaking through the immediate downtrend, we’ve a strong suspicion this shall prove worth watching.
At present, Boohoo are trading around 47p and visually, only need exceed 50p to hopefully trigger a nod in the direction of 59p. Achieving such a target shall be important, returned the share above Red, an uptrend which dates back to 2015. Our secondary, in the event 59p is exceeded, calculates at 75p, this ambition hopefully proving a footnote on a path to 97p and some almost certain hesitation, given previous stumbles around the pound level.
The visuals suggest quite firmly closure above 97p shall prove critical for the future, forcing us to revisit price movements and run some new calculations.
FUTURES
| Time Issued | Market | Price At Issue | Short Entry | Fast Exit | Slow Exit | Stop | Long Entry | Fast Exit | Slow Exit | Stop | Prior |
| 9:28:59PM | BRENT | 84.91 | Shambles | ||||||||
| 9:31:42PM | GOLD | 1903.71 | 1900 | 1890 | 1879 | 1909 | 1912 | 1915 | 1919 | 1904 | ‘cess |
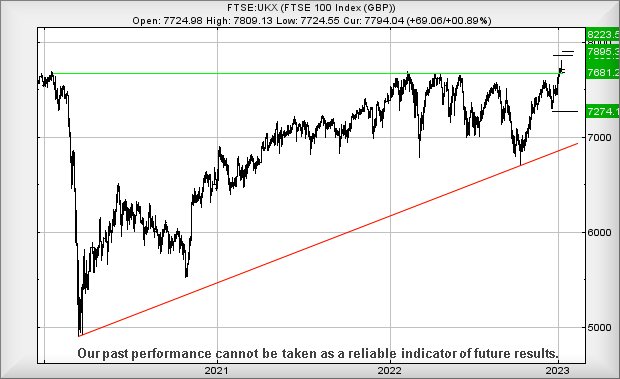
| 9:34:08PM | FTSE | 7795.74 | 7784 | 7769 | 7733 | 7821 | 7820 | 7823 | 7836 | 7797 | Success |
| 9:39:21PM | STOX50 | 4152.7 | Shambles | ||||||||
| 9:41:09PM | GERMANY | 15129 | ‘cess | ||||||||
| 9:44:53PM | US500 | 3929 | Success | ||||||||
| 9:47:38PM | DOW | 33269 | Success | ||||||||
| 9:49:21PM | NASDAQ | 11414 | ‘cess | ||||||||
| 9:52:21PM | JAPAN | 26481 | Success |
18/01/2023 FTSE Closed at 7830 points. Change of -0.27%. Total value traded through LSE was: £ 5,075,315,047 a change of -21.93%
17/01/2023 FTSE Closed at 7851 points. Change of -0.11%. Total value traded through LSE was: £ 6,501,128,630 a change of 48.1%
16/01/2023 FTSE Closed at 7860 points. Change of 0.2%. Total value traded through LSE was: £ 4,389,692,147 a change of -22.72%
13/01/2023 FTSE Closed at 7844 points. Change of 0.64%. Total value traded through LSE was: £ 5,680,414,260 a change of -0.9%
12/01/2023 FTSE Closed at 7794 points. Change of 0.91%. Total value traded through LSE was: £ 5,732,068,747 a change of -8.81%
11/01/2023 FTSE Closed at 7724 points. Change of 0.39%. Total value traded through LSE was: £ 6,286,062,115 a change of 15.31%
10/01/2023 FTSE Closed at 7694 points. Change of -0.39%. Total value traded through LSE was: £ 5,451,478,270 a change of 2.33%
SUCCESS above means both FAST & SLOW targets were met. ‘CESS means just the FAST target met and probably the next time it is exceeded, movement to the SLOW target shall commence.
Our commentary is in two sections. Immediately below are today’s updated comments. If our commentary remains valid, the share can be found in the bottom section which has a RED heading. Hopefully, this will mean you no longer need to flip back through previous reports. HYPERLINKS DISABLED IN THIS VERSION
Please remember, all prices are mid-price (halfway between the Buy and Sell). When we refer to a price CLOSING above a specific level, we are viewing the point where we can regard a trend as changing. Otherwise, we are simply speculating on near term trading targets. Our website is www.trendsandtargets.com.
UPDATE. We often give an initial and a secondary price. If the initial is exceeded, we still expect it to fall back but the next time the initial is bettered, the price should continue to the secondary. The converse it true with price drops.
We can be contacted at info@trendsandtargets.com. Spam filters set to maximum so only legit emails get through…
Section One – Outlook Updated Today. Click here for Section Two – Outlook Remains Valid shares
Click Epic to jump to share: LSE:AVCT Avacta** **LSE:BBY BALFOUR BEATTY** **LSE:CASP Caspian** **LSE:CNA Centrica** **LSE:EXPN Experian** **LSE:EZJ EasyJet** **LSE:GLEN Glencore Xstra** **LSE:GRG Greggs** **LSE:HIK Hikma** **LSE:IAG British Airways** **LSE:IHG Intercontinental Hotels Group** **LSE:JET Just Eat** **LSE:POLY Polymetal** **LSE:ZOO Zoo Digital** **
********
Updated charts published on : Avacta, BALFOUR BEATTY, Caspian, Centrica, Experian, EasyJet, Glencore Xstra, Greggs, Hikma, British Airways, Intercontinental Hotels Group, Just Eat, Polymetal, Zoo Digital,
LSE:AVCT Avacta. Close Mid-Price: 161.5 Percentage Change: + 4.33% Day High: 167.5 Day Low: 156
Target met. Further movement against Avacta ABOVE 168 should improve acce ……..
</p
View Previous Avacta & Big Picture ***
LSE:BBY BALFOUR BEATTY. Close Mid-Price: 356.6 Percentage Change: + 1.02% Day High: 358.6 Day Low: 352
All BALFOUR BEATTY needs are mid-price trades ABOVE 358.6 to improve acce ……..
</p
View Previous BALFOUR BEATTY & Big Picture ***
LSE:CASP Caspian. Close Mid-Price: 5.8 Percentage Change: + 6.42% Day High: 6.05 Day Low: 5.45
Continued trades against CASP with a mid-price ABOVE 6.05 should improve ……..
</p
View Previous Caspian & Big Picture ***
LSE:CNA Centrica. Close Mid-Price: 97.86 Percentage Change: + 0.66% Day High: 99.54 Day Low: 97.08
Target met. In the event of Centrica enjoying further trades beyond 99.54 ……..
</p
View Previous Centrica & Big Picture ***
LSE:EXPN Experian. Close Mid-Price: 3049 Percentage Change: + 2.97% Day High: 3089 Day Low: 2961
Target met. All Experian needs are mid-price trades ABOVE 3089 to improve ……..
</p
View Previous Experian & Big Picture ***
LSE:EZJ EasyJet. Close Mid-Price: 440.3 Percentage Change: + 1.01% Day High: 454.3 Day Low: 440
Continued trades against EZJ with a mid-price ABOVE 454.3 should improve ……..
</p
View Previous EasyJet & Big Picture ***
LSE:GLEN Glencore Xstra. Close Mid-Price: 576.6 Percentage Change: + 4.29% Day High: 584.5 Day Low: 552.9
Target met. All Glencore Xstra needs are mid-price trades ABOVE 584.5 to ……..
</p
View Previous Glencore Xstra & Big Picture ***
LSE:GRG Greggs. Close Mid-Price: 2636 Percentage Change: + 2.17% Day High: 2680 Day Low: 2610
Target met. Continued trades against GRG with a mid-price ABOVE 2680 shou ……..
</p
View Previous Greggs & Big Picture ***
LSE:HIK Hikma. Close Mid-Price: 1711 Percentage Change: + 0.35% Day High: 1722 Day Low: 1687
Target met. Further movement against Hikma ABOVE 1722 should improve acce ……..
</p
View Previous Hikma & Big Picture ***
LSE:IAG British Airways. Close Mid-Price: 161.04 Percentage Change: + 2.61% Day High: 162.92 Day Low: 158.08
Target met. Further movement against British Airways ABOVE 162.92 should ……..
</p
View Previous British Airways & Big Picture ***
LSE:IHG Intercontinental Hotels Group. Close Mid-Price: 5580 Percentage Change: + 2.20% Day High: 5628 Day Low: 5530
Target met. Continued trades against IHG with a mid-price ABOVE 5628 shou ……..
</p
View Previous Intercontinental Hotels Group & Big Picture ***
LSE:JET Just Eat. Close Mid-Price: 2215.5 Percentage Change: + 4.06% Day High: 2452.5 Day Low: 2204
Target met. All Just Eat needs are mid-price trades ABOVE 2452.5 to impro ……..
</p
View Previous Just Eat & Big Picture ***
LSE:POLY Polymetal. Close Mid-Price: 350 Percentage Change: + 8.02% Day High: 360 Day Low: 338
Further movement against Polymetal ABOVE 360 should improve acceleration ……..
</p
View Previous Polymetal & Big Picture ***
LSE:ZOO Zoo Digital. Close Mid-Price: 166 Percentage Change: + 4.40% Day High: 168 Day Low: 157
Weakness on Zoo Digital below 157 will invariably lead to 139 and hopeful ……..
</p
View Previous Zoo Digital & Big Picture ***